
Hey, this is Pro Trader Bryan Bottarelli.
Today, I’m going to show you the easiest way to answer the most important question in investing...
Is NOW the “Perfect” Time to Buy?
More than anything else... this is the one question that drives investors crazy.
Is it the best time to buy the Dow... the Nasdaq... or the S&P?
Or...
Is NOW the best time to get in that one cheap stock before it blasts higher?
And even...
Could this be the absolute worst time to buy?
Well, in the next few minutes... you’re going to get the answer.
I’m going to show you how to add a simple indicator to any stock chart... which will allow you to find the “PERFECT” moment to buy.
In fact... as I’ll show you in just a few minutes...
We applied this to historical market data and found this indicator flashed green before the biggest stock surges in 2025.
Meaning it could have helped spot opportunities to make 334%... 748%... and even 1,191%... in three months or less!
I love helping people unlock huge returns... fast.
In fact... followers of some of my other work have even seen lightning-fast gains of 73% in less than 10 minutes...
54% in just four minutes.
And even 121% gain in just 81 minutes!
In short... we’re talking about...
BIG gains.
FAST.
And the secret I’m sharing with you today is unlike anything I’ve seen in over 20 years trading the market.
In fact... I WISH I had access to this when I started trading in the live pit of the Chicago Board Options Exchange in the early 2000’s!
Because with this ONE simple trick... you can unlock the “perfect timing” indicator on any stock chart you want.
What I’m saying is...
Pull up any stock chart...
And you’ll know within seconds the best time to buy.
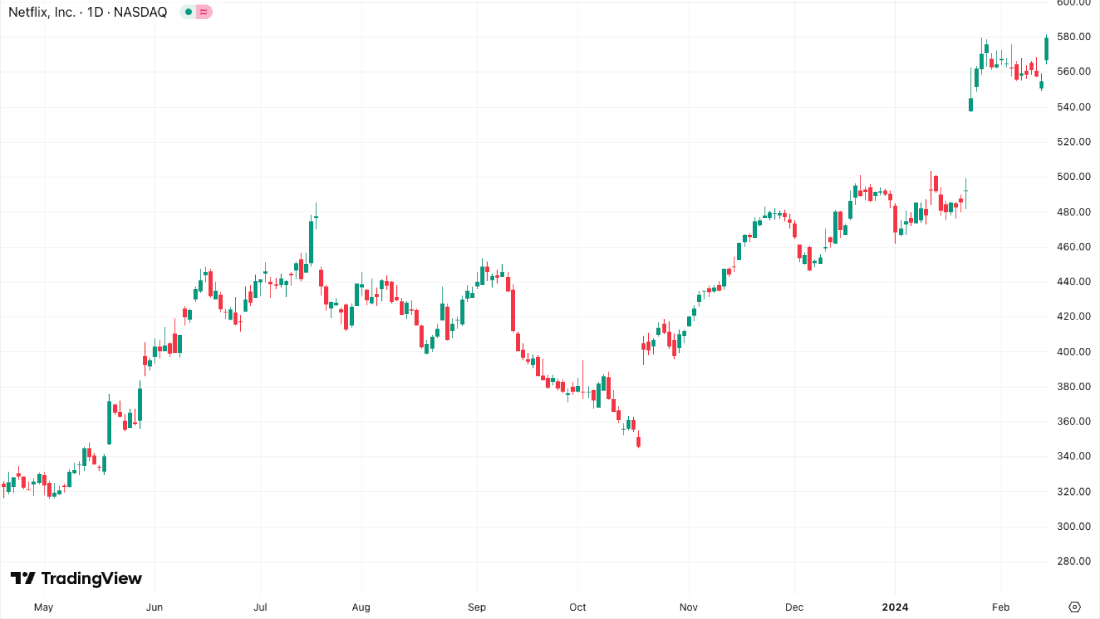
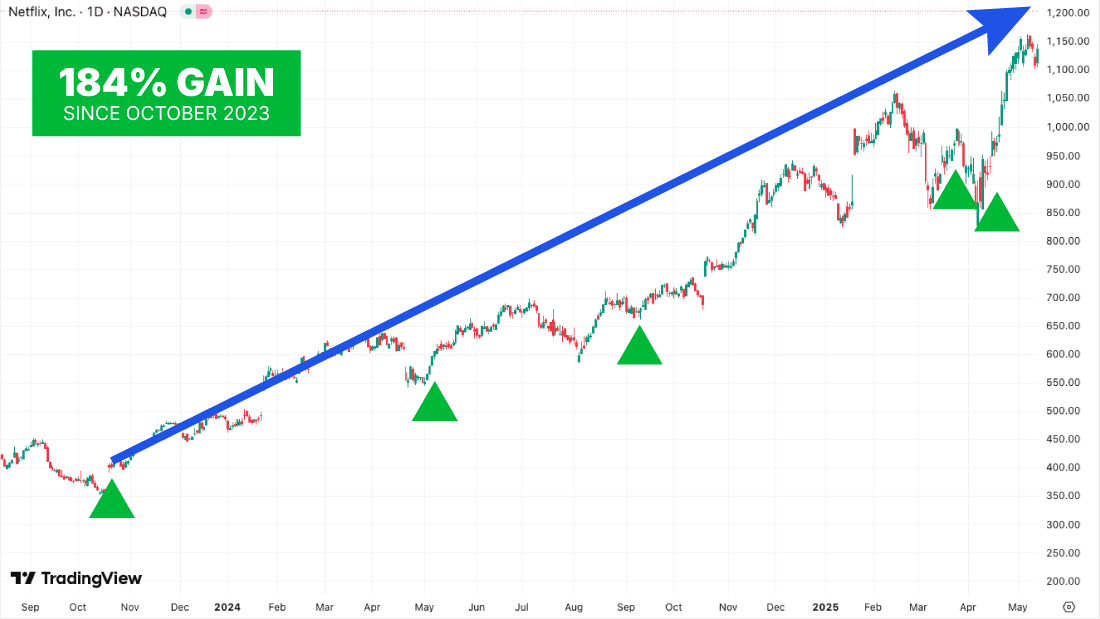
For example, look at this chart of Netflix.
It’s just a simple chart... but watch what happens when I activate the “perfect timing” indicator...
Take a look...
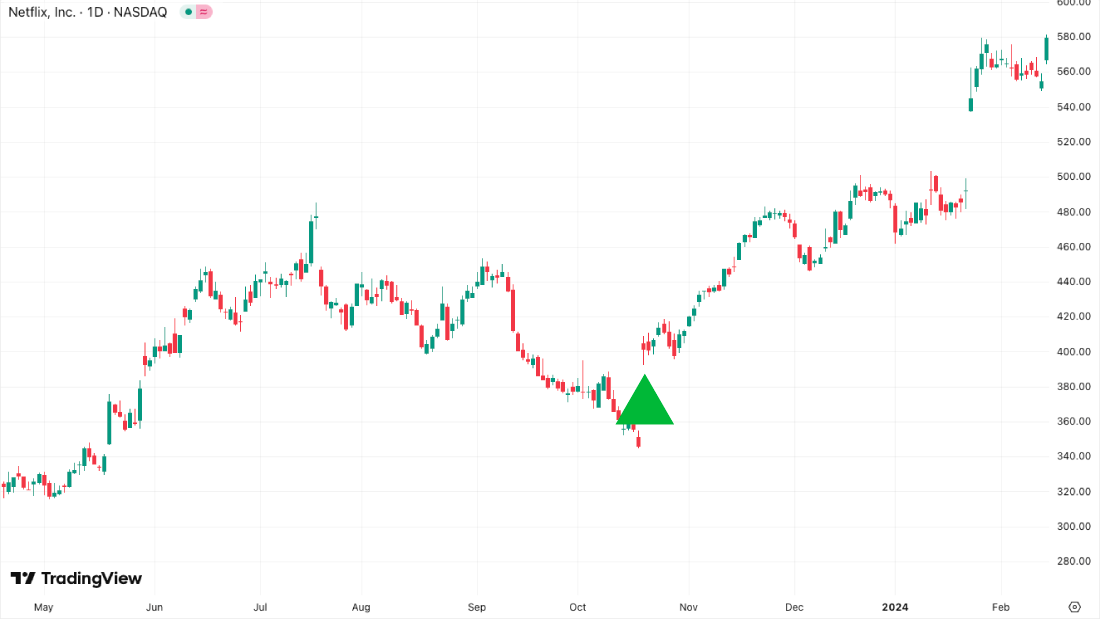
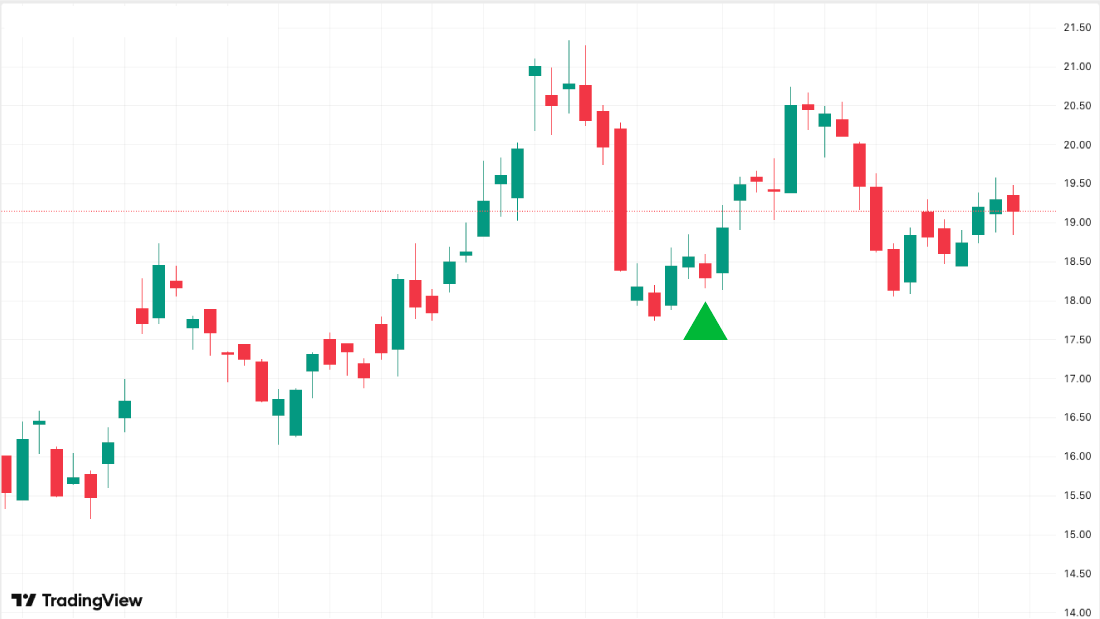
Green arrows appear just before the stock hits a great buying opportunity.
Look.. Netflix bottoms here...
Here... Here... And so on...
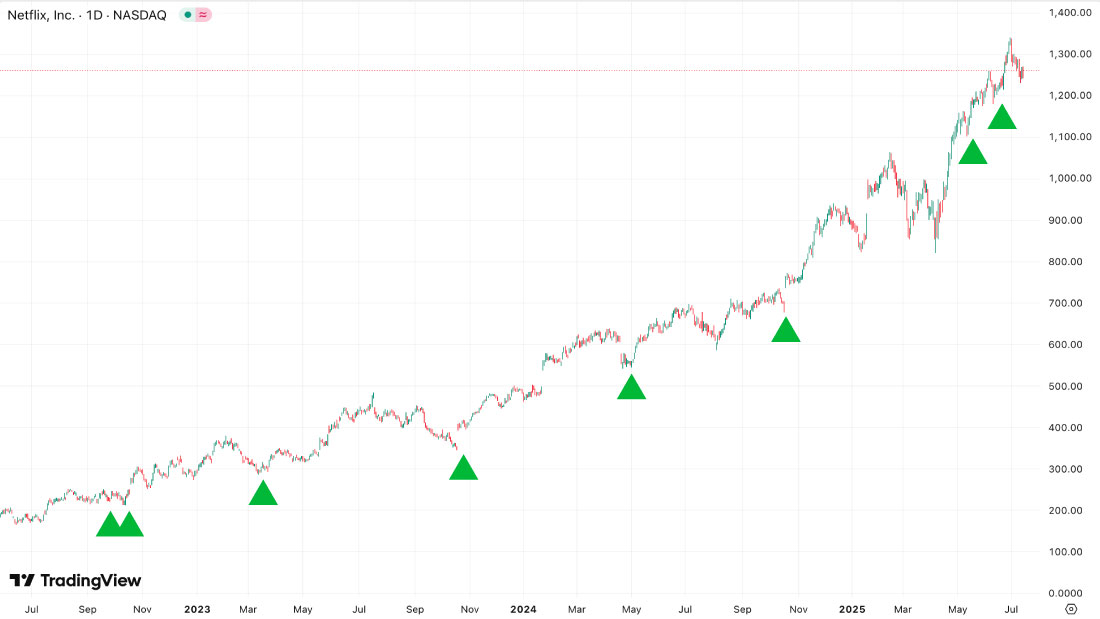
Notice that every time the stock hits a significant bottom... the green arrows appear... telling you to buy just as the stock resumes its uptrend.
This is the perfect “buy the dip” strategy.
Thanks to this simple indicator... you will no longer have to guess when it’s the best time to buy.
You simply wait for the green arrows to appear on a stock you want to own.
It’s why we call it the “Perfect Timing Indicator.”
It’s so powerful... our testing shows green arrows would have flashed on the top moving stocks of 2025...
BEFORE they rocketed up!
You heard me right...
The green arrow appeared BEFORE the biggest stocks moves this year!
And today... I’ll show you how to unlock this special chart on ANY stock you want.
Doesn’t matter if it’s a small stock... a bio stock... a tech stock...
Heck... it even works on crypto.
This thing works on everything.
Take one of the most suprising winners of 2025... CVS...
The green arrow appeared right here...
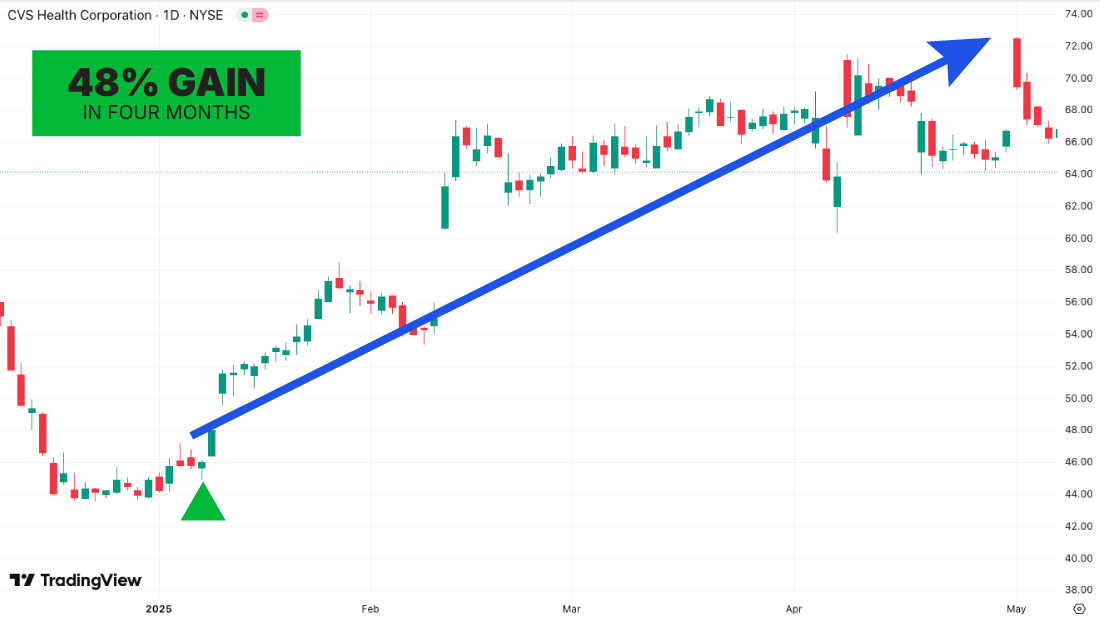
Right before a 48% move...
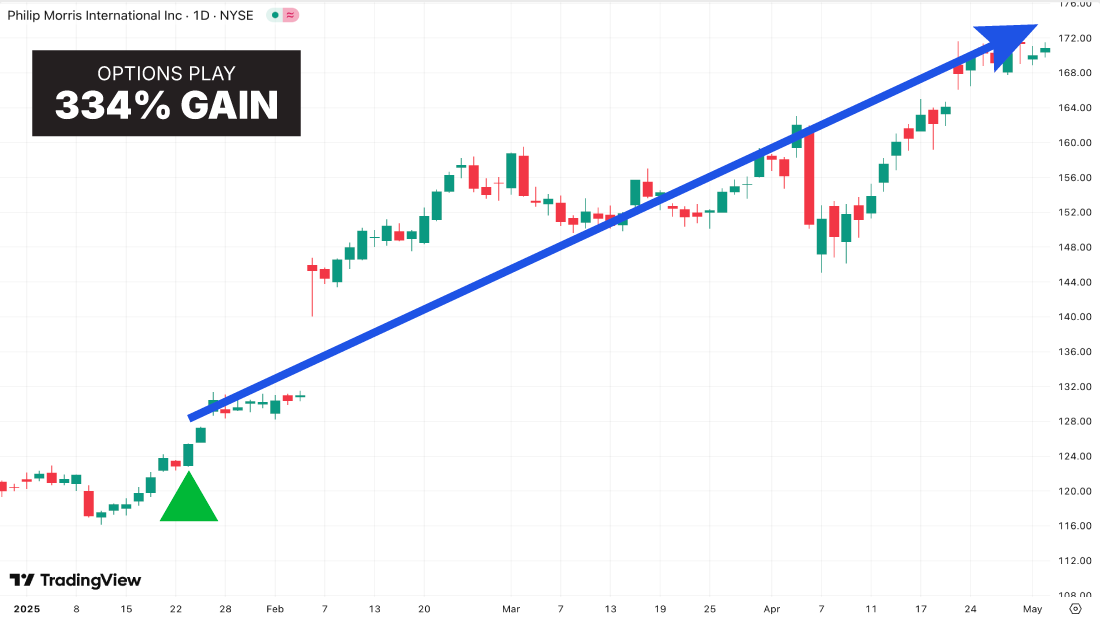
Same with Philip Morris...
Green arrow appeared here...

And the stock went up 32% over the next three months.
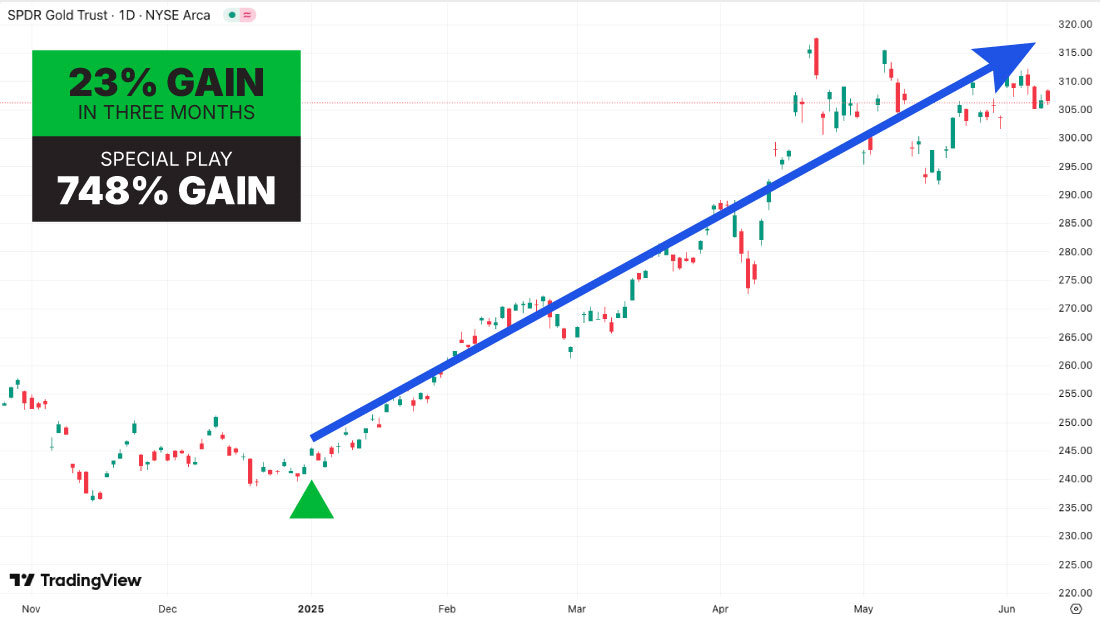
How about gold stocks?
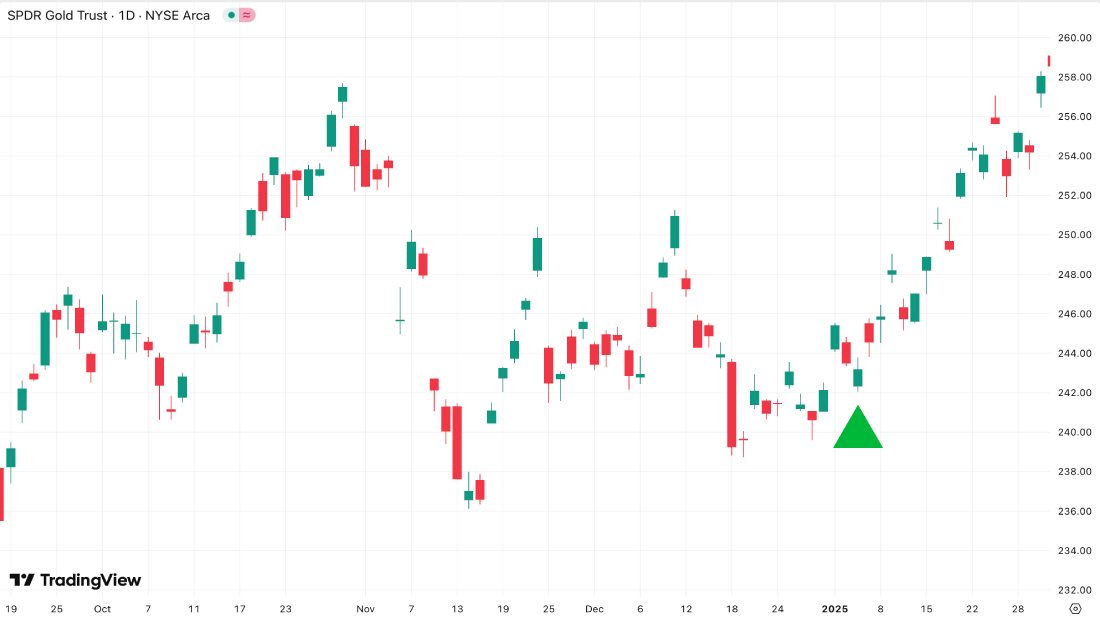
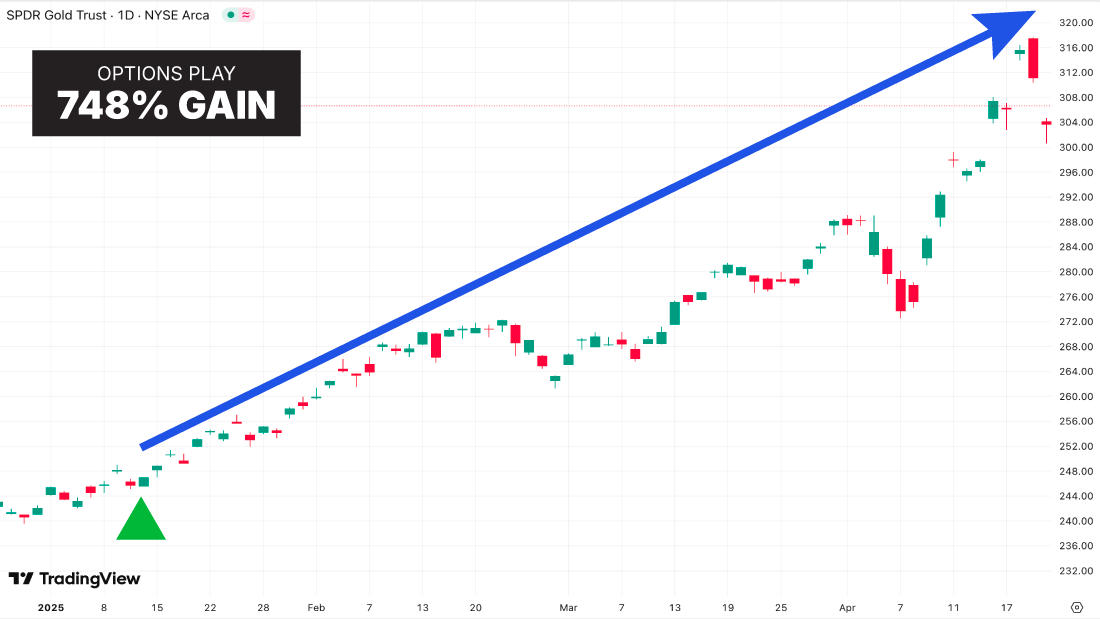
Well, the green arrow flashed on the Gold ETF GLD...
In just three months... it went up 23%...
And a special play I’ll show you could have multiplied those gains to 748%!
Just right there...
I’ve shown you Netflix... a tech stock...
CVS... a retail pharmaceutical...
Philip Morris a consumer discretionary...
And even a gold ETF.
This perfect timing indicator would’ve worked on every single one of them.
And... I’m just getting warmed up.
In the next few minutes... I’ll reveal exactly how you can get these green arrows on your computer screen...
Any time you want... with any stock...
In seconds.
It’s really this simple...
You turn the green arrows on.
Then wait for them to appear on your favorite stocks.
And then you know...
NOW is the best time to buy.
In fact... just last year...
These green arrows could have helped spot the best time to unlock gains as high as:
- 199%
- 1,191%
- 334%
- 748%
- 432%
- 260%
- 151%
- 281%
- 218%
And many more!
You can see them all on your screen...
Just look at that monster 1,191% return!
Keep in mind...
These gains all could have been locked in within three months... or LESS!
So how do you add these green arrows to your stock chart?
And how exactly does it work?
That’s what I will show you today.
To be frank, it’s as simple as a copy and paste.
And I’ll show you exactly how to do it... starting now.
Why The Market is The Greatest Wealth Generator in History
Before we begin, allow me to introduce myself.
As I said before, my name is Bryan Bottarelli.
I started in the Apple pits of the Chicago Board Options Exchange back in the early 2000s.
It was wild and exciting.
But now... I trade every day from the comfort of my own home with a multimillion-dollar portfolio.
I travel the world.
I spend a few months a year in my cabin in Big Sky, Montana.

And best of all, I have the freedom to enjoy life on my terms with my family.
I’m deeply grateful — and I owe so much of it to the stock market. I know that might sound strange, but it’s true.
The market has taken financial worry off the table for me.
And that’s why I’ve made it my mission to teach others how to achieve the same kind of freedom.
I call the stock market the single greatest wealth generator in history.
Think about it...
TRILLIONS of dollars flow through the market every single day.
Creating millionaires on any given market day...
And you could be one of them!
That’s the reason thousands of people follow my trades and tune into my teachings.
The goal here is simple: I want to hand you an approach that can help you finish each day wealthier than you started it.
And along the way, I’m going to share some powerful stories from people I’ve taught in some of my highest VIP services.
People like David — who started with $20,000 and turned it into $185,000 over nine months.
Another student, Jim, made nine trades between November 30 and January 4. All nine were winners. One of them gained 112%.
And then there’s Steve.
He went all in for a week — made 37 trades. 32 were winners.
His entire account went up 50%... in just one week.
But the most amazing story is what I got from a student named George.
In the midst of the COVID Crash... he knocked it out of the park.
He turned $165,000 into peak gains of $2.3 million in just three months using some of the methods he learned in our elite trading community.
Those results are extraordinary, and of course, everyone’s experience will vary based on their unique situation and the amount of risk they are taking.
But no matter what your situation is... and what your starting point is...
You CAN succeed... and you CAN start building your wealth.
All you need... is the right tool.
And that’s exactly why I created the “Perfect Timing” Indicator...
I wanted to help everyone answer that most basic question...
Is NOW the best time to buy?
My research team and I created the best way to tell if a stock was about to surge.
Some people look at candlestick formations... others look at Bollinger bands... money flow...
But we discovered that one special combination preceded BIG moves in stocks... over and over again.
After seeing this combination applied to every major stock chart, I remember saying, “This indicator is PERFECT.”
From there... the research team created a special code that you can copy/paste into your very own stock chart on your screen... and with that, the Perfect Timing Indicator was born.
It's extremely easy to use, and answers the most important question in wealth creation: when is the best time to buy?
That’s why I’m so excited to share it with you today.
Look, we all know there is no crystal ball for the market.
But in 20 years trading the market... this indicator is as close to “perfect” as I have found.
It easiest and most consistent indicator I’ve ever found to identify the best time to get into any stock...
And it uses one simple strategy:
Buy ONLY stocks that are going UP.
I admit...
It sounds super simplistic.
But stick with me... because I’m going to teach it to you right now.
So let me share my screen, and let’s get started.
Ok... now you should be able to see my screen.
Here is the first step.
What I am going to show you works on a platform called TradingView.
I should be clear.
I’m not affiliated with TradingView in any way.
It’s simply the best free stock website.
And TradingView allows you to copy and paste my “perfect timing” indicator directly into the website so the green arrows appear on any chart...
Right on your very own computer screen.
Let me show you.
Let’s pull up one of the top performing stocks on TradingView from the beginning of this year.
Philip Morris.
Let’s zoom in...
Ok you can see the chart, correct?
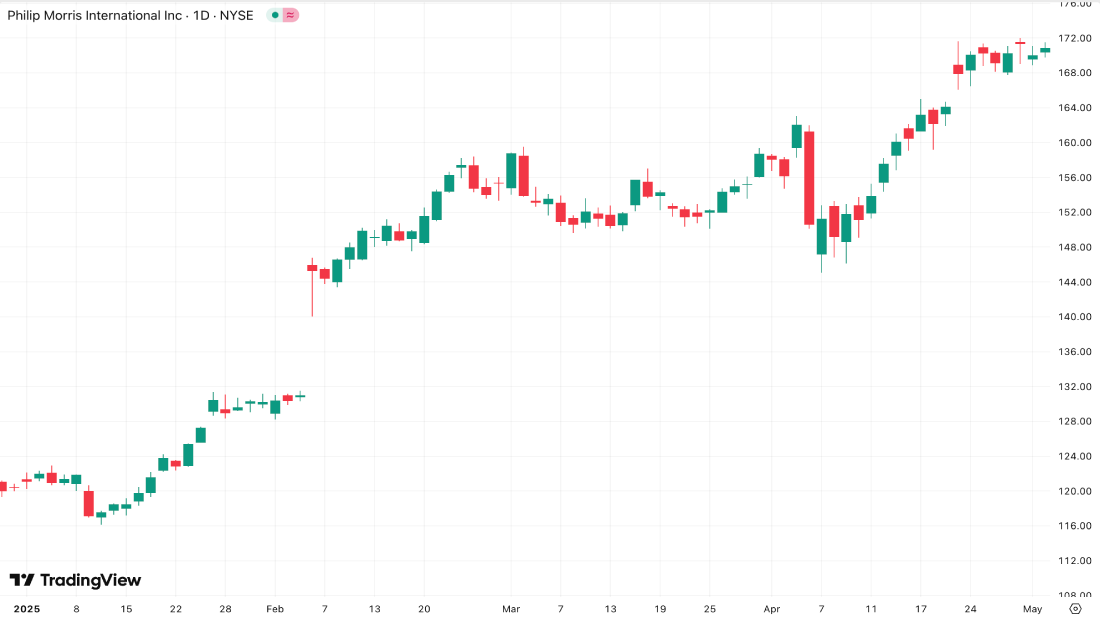
Do you see this massive surge up right here?
The chart alone gives no indication this surge is going to happen...
But now... let me turn on the “Perfect Timing” Indicator.
Boom.
LOOK AT THAT!
See the green arrow?
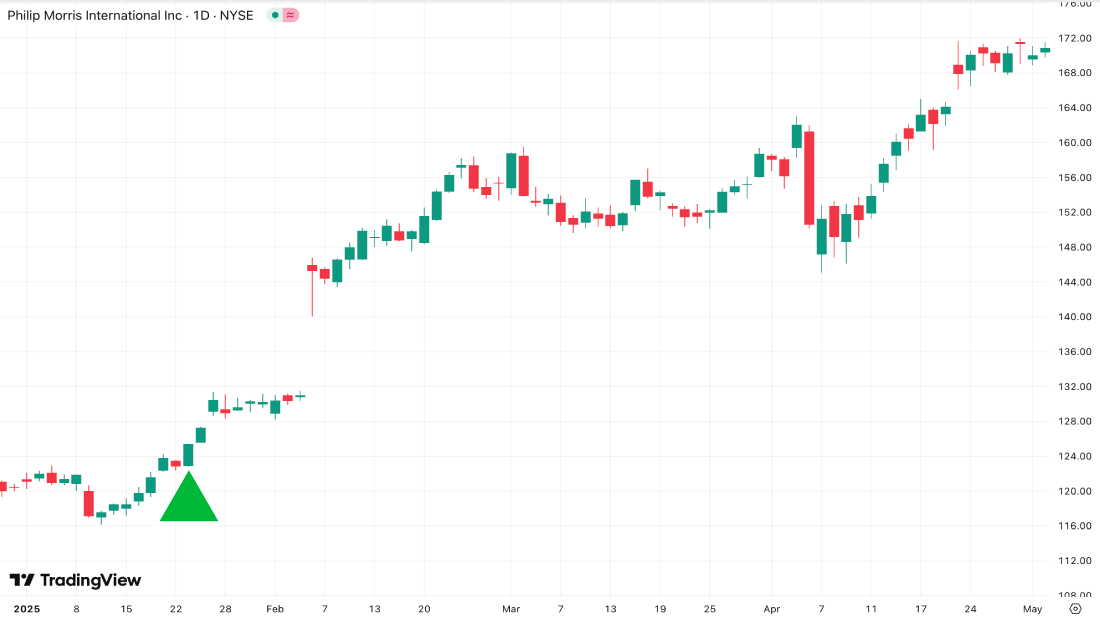
There it is... days BEFORE the big surge!
So if you were looking at Philip Morris trying to figure out if now was the time to buy... this could have been extremely helpful.
Looking back... the green arrow would have flashed while the price was about 125.
From there... it went as high as 171 ...
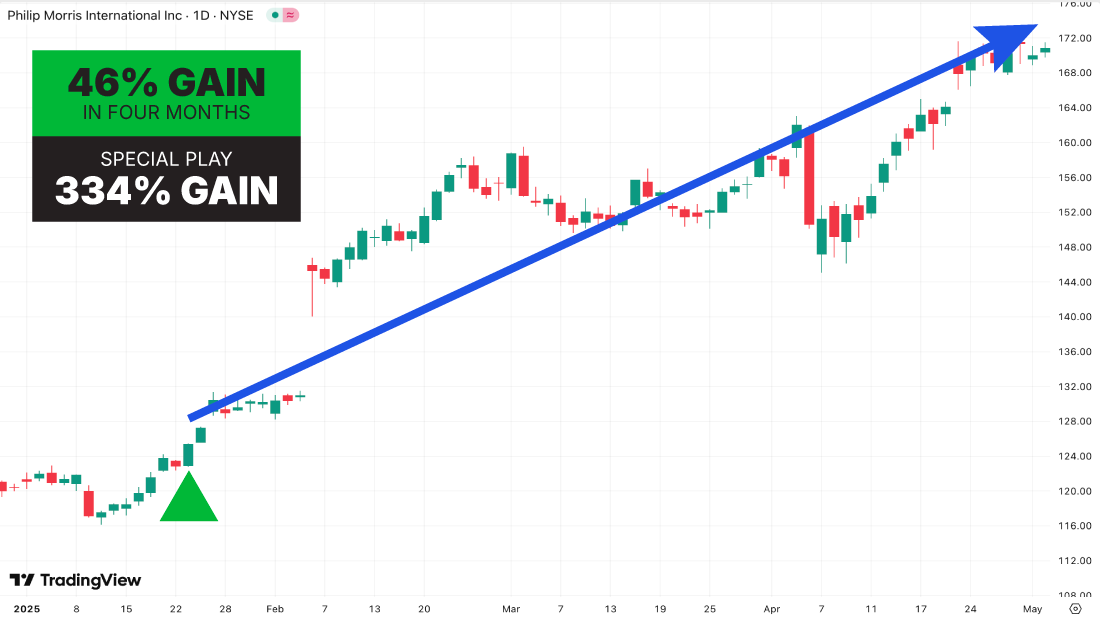
That was a 46% gain in just four months.
But that’s just the beginning...
Because I have a special way to boost that 41% gain...
And push it to as high as 334%!
Don’t forget what I told you before...
This “Perfect Timing” indicator works on way more than stocks.
7X Gains in Three Months... on GOLD?!?
Let’s type in GLD...
That’s the ETF that tracks the price of gold.
You can even look at commodities like Gold... Silver... Oil... you name it!
And yes... you could even use this on cryptocurrencies too.
But I’m getting ahead of myself.
Back to gold...
It was on a major tear for the beginning of 2025.
But here’s what I want to show you...
And this is what makes this “Perfect Timing” indicator truly special...
From September to December of 2024...
GLD went nowhere.
Flat line.
Dead money.
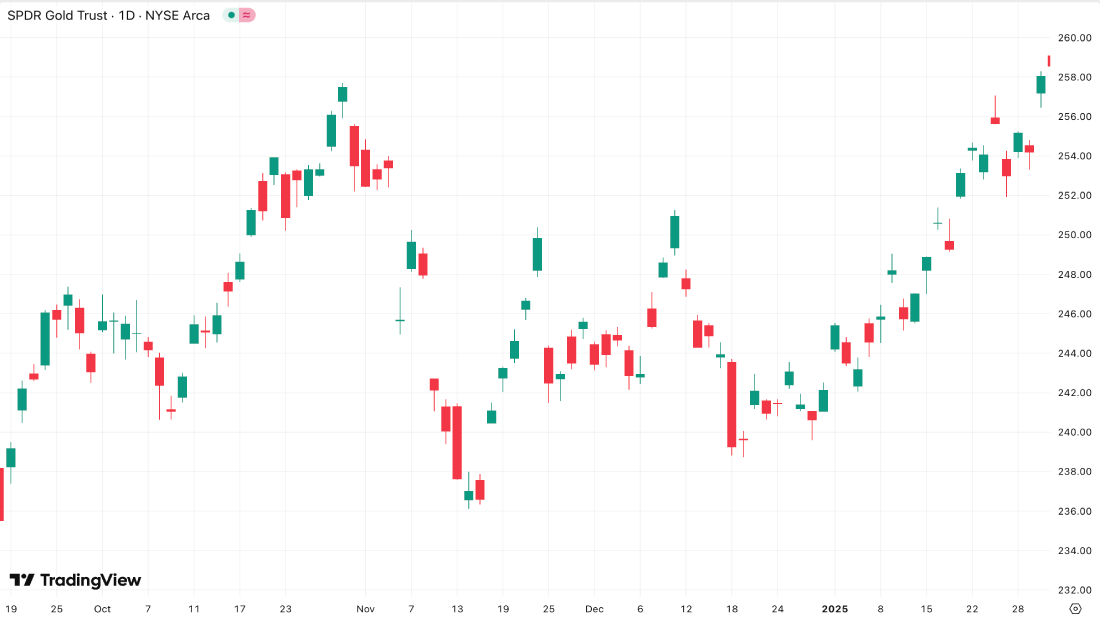
This is NOT the time you want to hold the ETF.
It’s the kind of months that make regular buy and hold investing so annoying.
You get in... and wait... and wait.
But now...
Look what happens when we turn turn on the arrows...
Bam... Look at that...
It could’ve identified the precise time to avoid the flatline...
And only buy before it shoots higher.
Now... really let that sink in.
Rather than buying and waiting 4 months for the price of gold to essentially go nowhere...
This little green arrow could have helped skip ALL of that.
And indicated when it’s the best time to buy.
Look... it’s right there in in January.
And look what happened immediately after the green arrow would have appeared.
Blastoff!
Gold went up 23% by April.
And the special play I’ll show you today...
Went up by 748%!
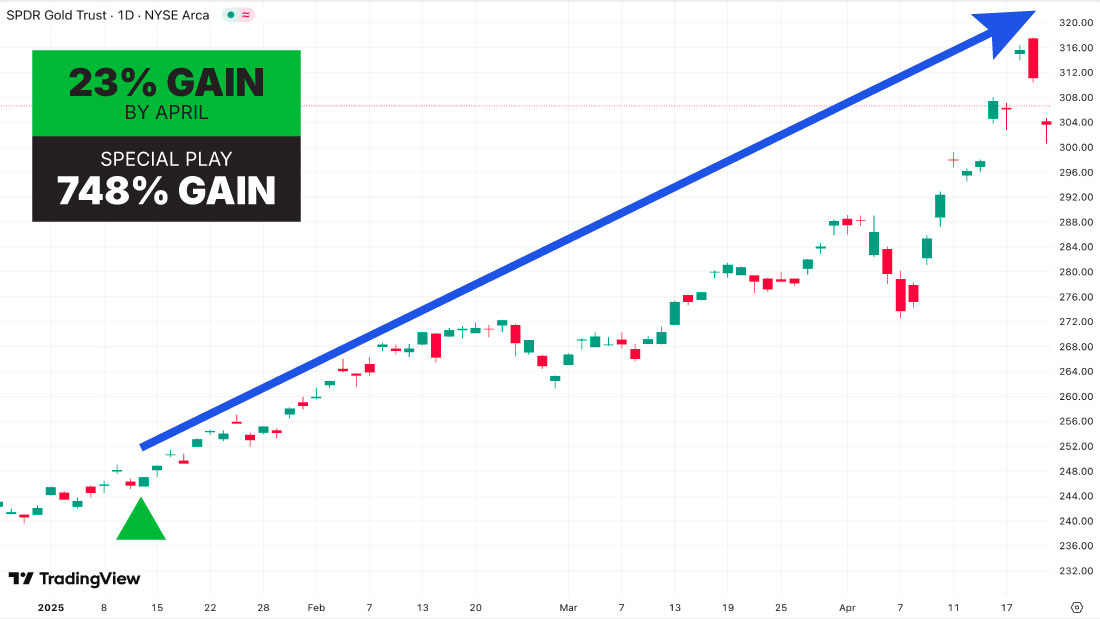
That’s enough to grow $2,000...
Into almost $17,000!
In a matter of months.
It’s truly incredible.
If that doesn’t get your blood pumping...
Honestly you should check your pulse right now.
Hopefully you’re beginning to see why we call this “The Perfect Timing Indicator.”
But we are just getting started...
Because the very best winner will just blow your socks out.
Green Arrows Would’ve Flashed Before a 1,100% Move... in Just 90 Days!
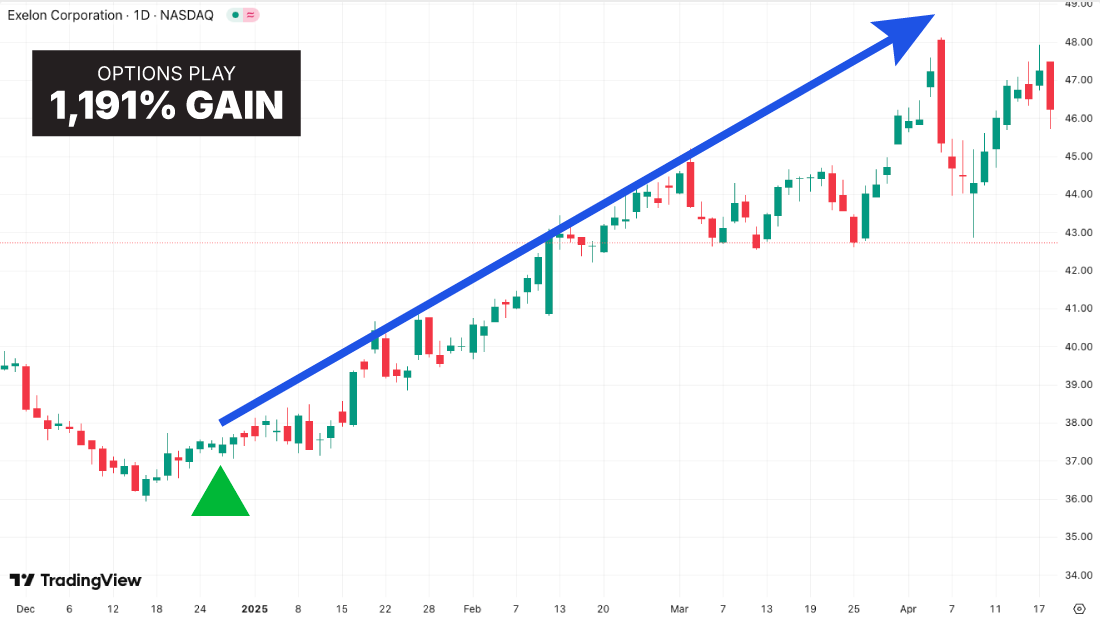
Let’s type in EXC into TradingView.
And let’s look at the very end of 2024.
As you can see... it dips down in the beginning of December.
And again... if we’re just looking at the chart... you’d have no clue when you should get in.
Should you get in immediately when it starts rising?
Or wait for another dip?
Well, let’s turn on the green arrows... and the answer is clear as day!
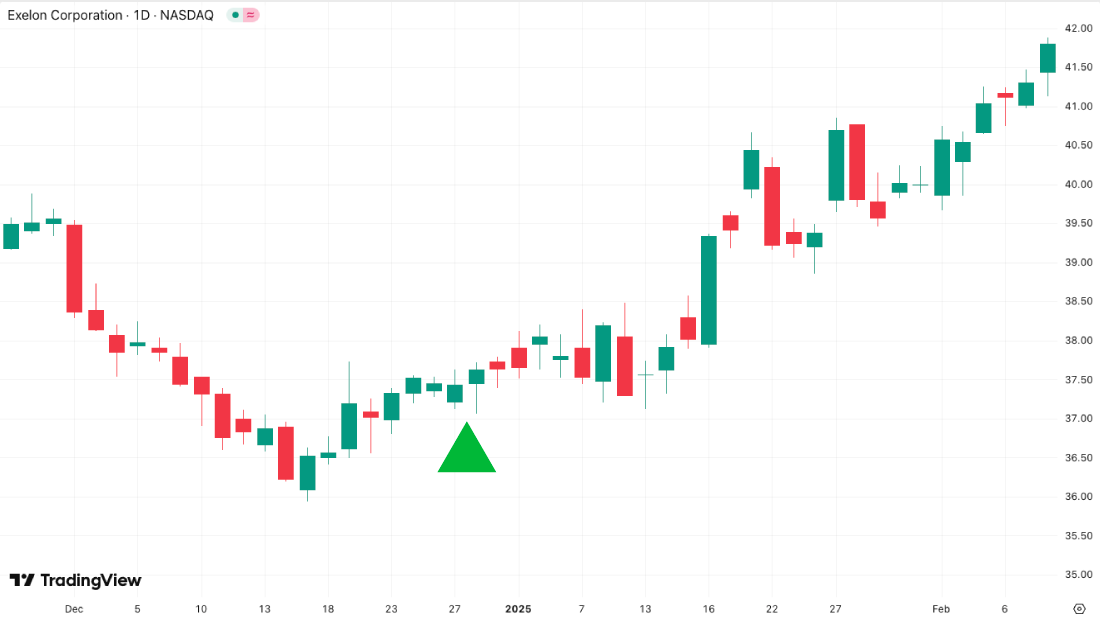
There it is! Right there at the end of December.
And the stock then went up 26% by April.
But the right booster play could have made absolutely life-changing returns...
Because it went as high as 1,191%.
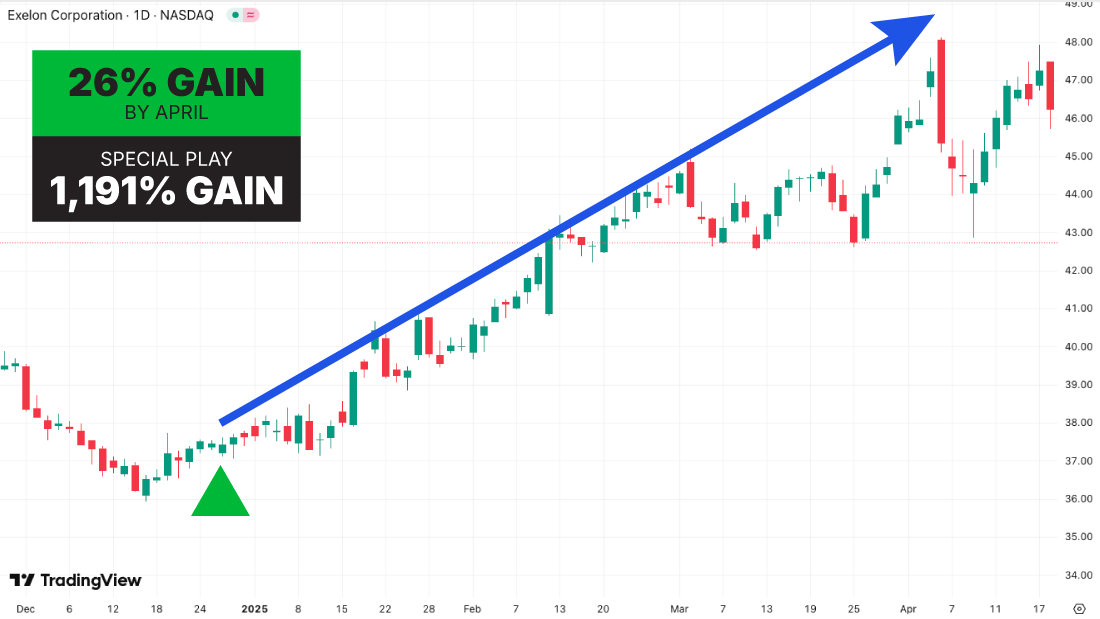
That’s right...
Over 10X... a ten bagger all in a matter of months!
$200 in it...
Would have been worth more than $2,500!
$2,000 would have blasted into more than $24,000...
And $5,000 would have exploded into over $60,000...
All thanks to the help of the “Perfect Timing” Indicator!
Now... we’re looking back at historical examples to see how big these moves were to show you the full upside.
Of course, your results will vary. I just wanted to show you how powerful this can be.
Ok... so let me show you how to set this all up...
Let’s dive into how you you go in TradingView (which is free to use)... and how you can add the green arrows.
It’s super easy.
Let me walk you through it.
I’ll open up a new tab right now...
We type in TradingView.com.
Now again, let me be super clear upfront...
I have zero affiliation with TradingView.
I don’t get a dime for recommending it. I’m not an ambassador, I don’t have a discount code, and I’m not collecting commissions.
I’m only telling you about it because I personally use it every single day...
I think it’s flat-out the best tool out there for charting, setting alerts, and most importantly... using the custom indicator I’m going to share with you.
Best part?
It’s 100% free.
Just click “sign up” in the top right corner...
Then, you choose a sign up method.
You can use
- Apple
That’s all it takes. And again... it’s free.
Now, once you’re in, you can pull up charts for any stock you want.
And you can look at multiple timeframes as short as one minute... and as long as one full year.
Now here’s the cool part.
You can add the “Perfect Timing” Indicator to all your charts.
All you do is go down here to the bottom...
Click on Pine Editor.
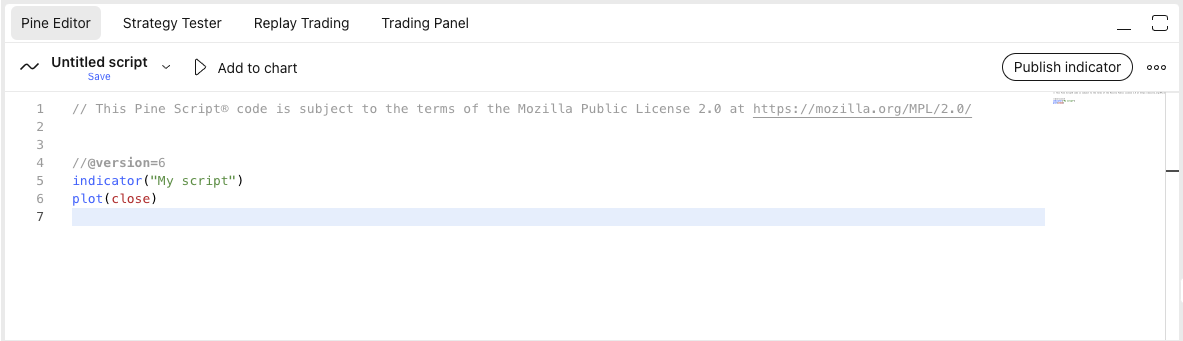
Now... this is the most amazing part.
All you do is copy and paste 39 lines of code that will instruct TradingView to add the green arrows to every chart..
Now... don’t try to write all this down right now.
I’ll show you how you can get this exact code in just a second...
I’ll send it right to your email.
You’ll be able to just copy and paste it right here.
I know... It looks like a bunch of random gibberish...
But all you do is highlight it...
Hit copy...
Then paste it right in that editor.
Then... you just click “Publish Indicator”.
Then you can look up any stock... index... ETF... crypto...
Whatever you want!
Just click the magnifying glass at the top...
And hit search.
You’re done. That’s it.
If that’s too much work for you...
Then stop reading right now.
I can only hand you the golden ticket.
But if copy and pasting into a FREE website is too much “hard work” for you...
I can’t help you get rich.
But since you are still with me...
That means only one thing...
You’re READY to get the tools you need to change your life.
So let’s dive in a little bit more.
Even in a Down Market...450% Gains in Three Months During THE COVID CRASH!
I’m going to make a really important point...
I’m going to use the indicator on the Nasdaq triple Q... the QQQ
And we are going to go back to 2020.
Why?
This will show you the true value of the Perfect Timing Indicator.
Ok... so here you can see the obvious crash in 2020, right?
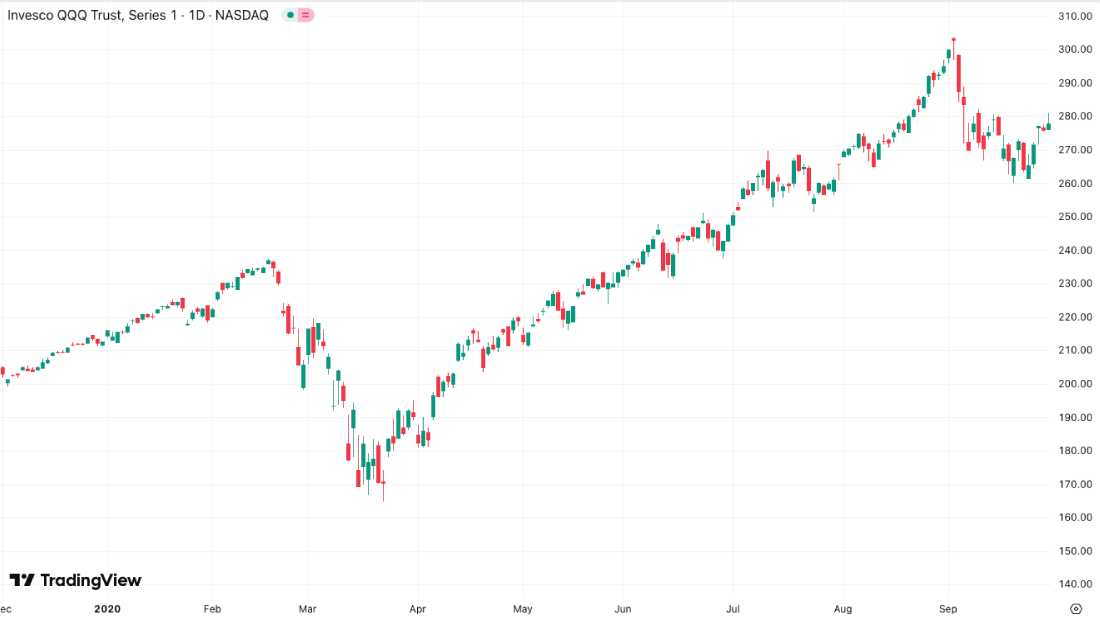
You probably remember how awful it was.
And if you think back...
Every single day on CNBC...
They debated it over and over...
Is NOW the best time to buy?
Is the bottom in.
Guess what... not a single person I saw had any clue how to answer that question.
But, let’s see what the“Perfect Timing” Indicator would have shown.
We turn on the green arrows again...
And there it is...
That one simple green arrow avoided all the pain of the big drop.
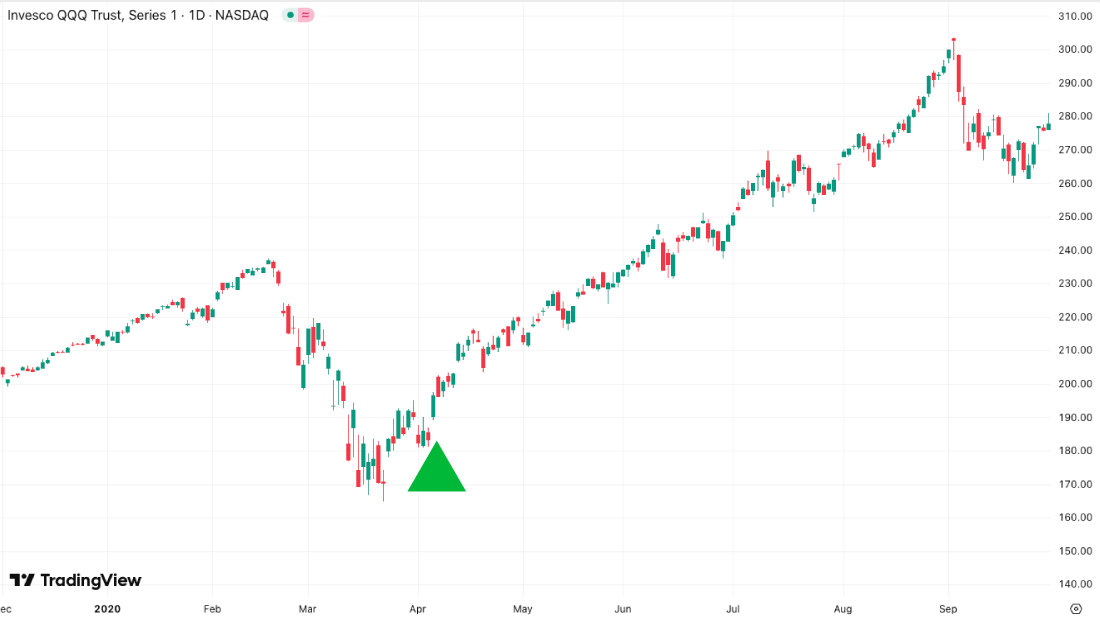
And showed almost exactly when the market was a buy once again.
That’s the power of the “Perfect Timing” Indicator.
It’s designed to identify the biggest “dip buying” opportunities.
And it’s super easy.
The green arrows flash when it predicts the bottom is in...
And when it’s the best time to buy!
These are truly the moments where someone can make the most money as fast as humanly possible.
And if someone got in at the first green arrow in April...
They’d be sitting on about 169% gains now.
And...
I’ll show you an even more powerful strategy that could have made as much as 451% in just three months!
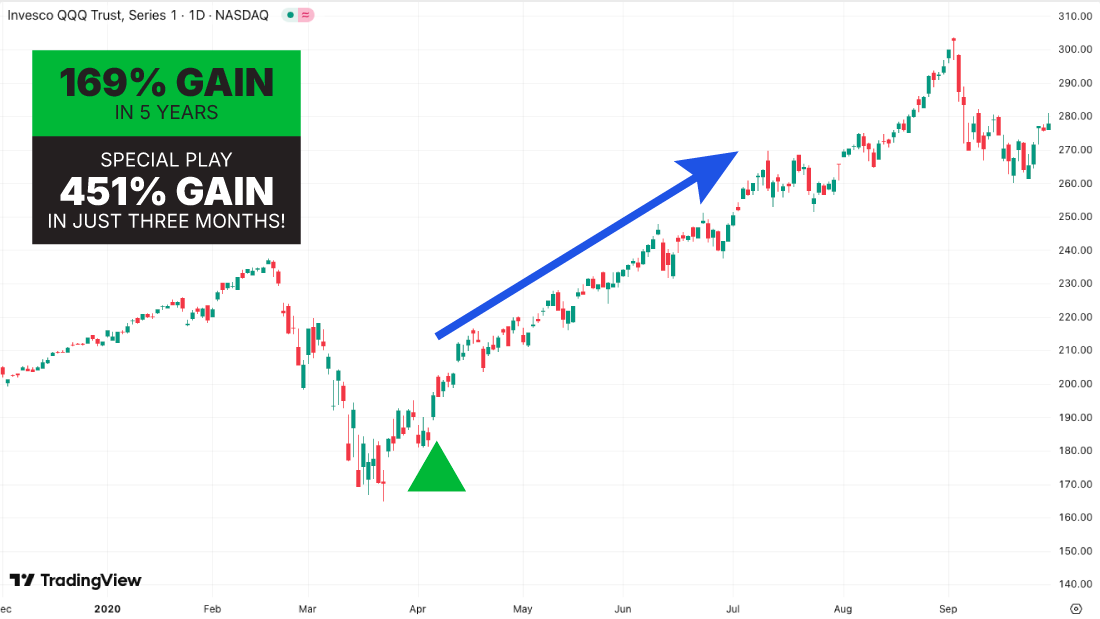
That’s right...
Bigger gains... in LESS time than buying and holding the QQQ for 5 years...
Keep in mind...
This is designed to help you decide when is best to buy good stocks or indexes that you already like.
If you have a retirement account... like a 401(k)...
This could help you.
If you want to figure out when you should buy the DOW... S&P... Nasdaq...
This could help you.
If you have a stock you’ve been waiting for the right time to buy...
This could help you.
Would You Rather Have 21%... Or 260% Gains Within Three Months?
So let’s take a second and imagine how this indicator could work for you.
Let’s imagine you decided you wanted to trade just the biggest name stocks using the “Perfect Timing” Indicator.
Let’s pull up Google...
Now let’s zoom in to September of 2024.
Ok... once again...
Looking at only the chart... you don’t see much.
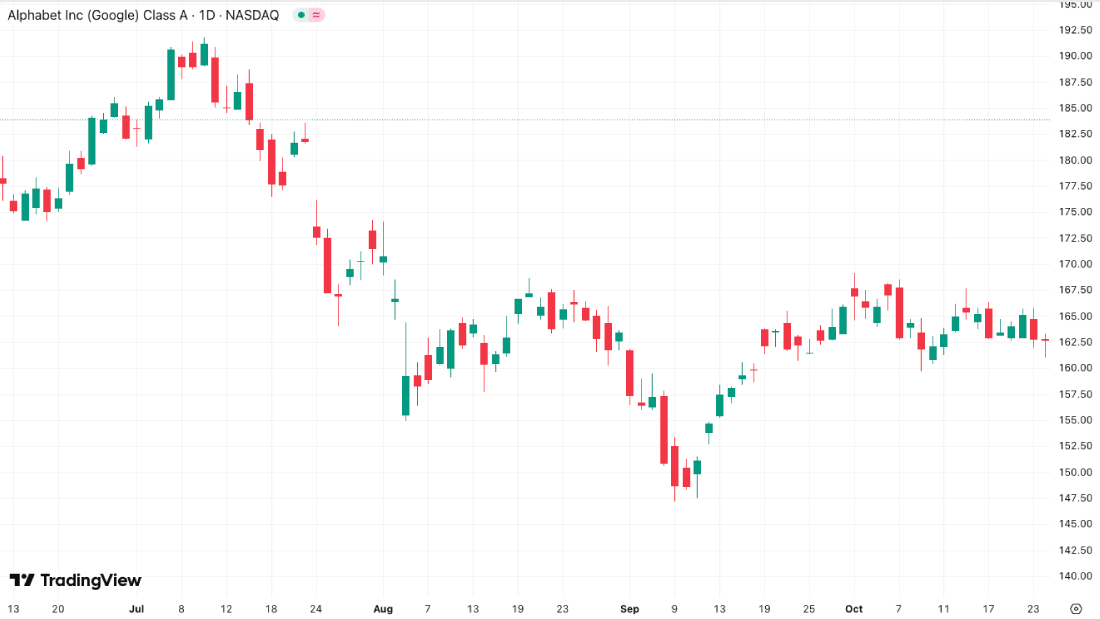
You see it dip... then go back up... then dip some more.
This makes everyone – even veteran traders like me wonder the exact same thing...
When is the best time to buy?
Now... let’s turn on the green arrows.
Boom... You see it?
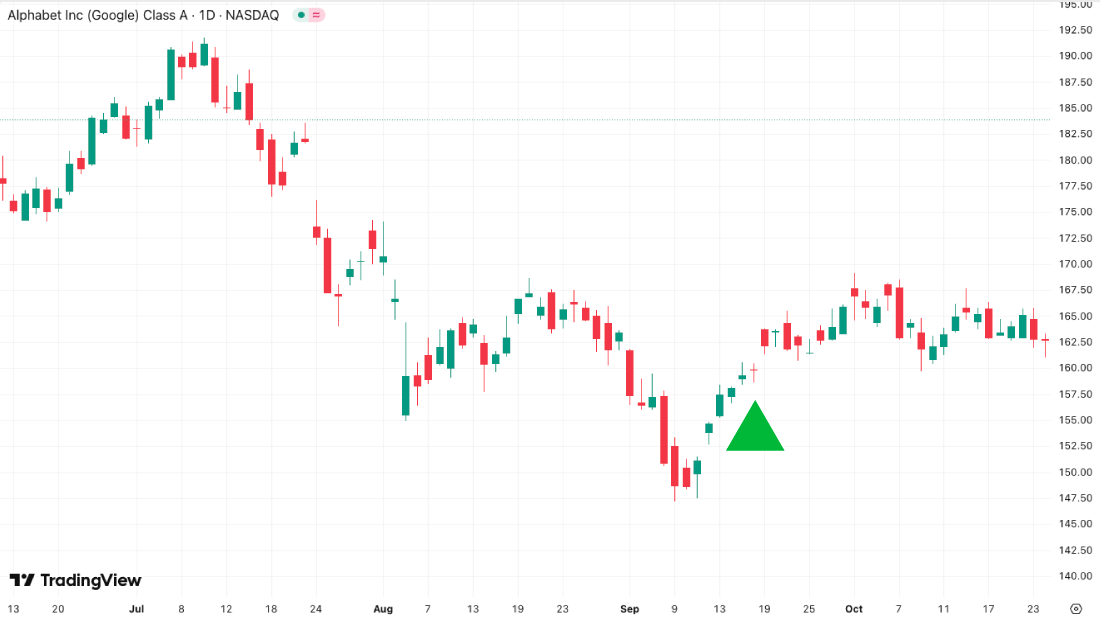
Right there.
The green arrow appears.
Did it work?
Well let’s go forward...
Sure enough... the momentum reversed pushed the stock up as high as 21% within three months.
Now think about that... most large cap stocks don’t move that much in a year.
Making 21% in three months on one of the biggest stocks in the world...
That’s incredible.
But... here’s how we can collect even more.
Knowing that the odds are in our favor, we can use the power of options...
To multiply our gains 10-fold... or even better.
In this case... the options moved as much as 260%!
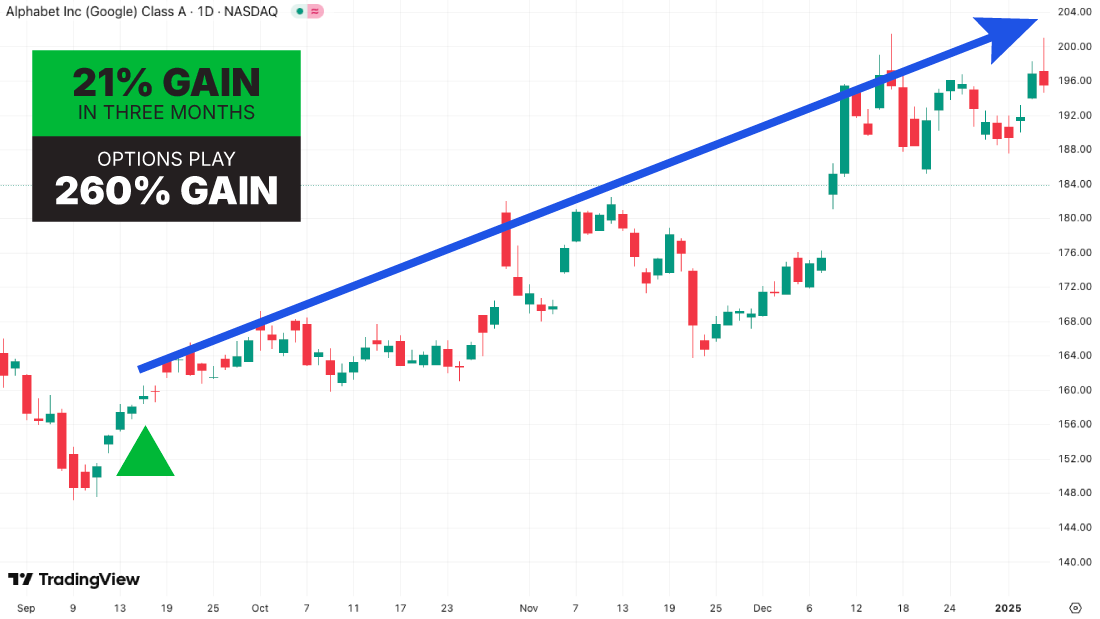
So again... 21%...
Versus 260%.
That’s more than 11X better.
Here’s another example...
Ride The Momentum for up to 432%!
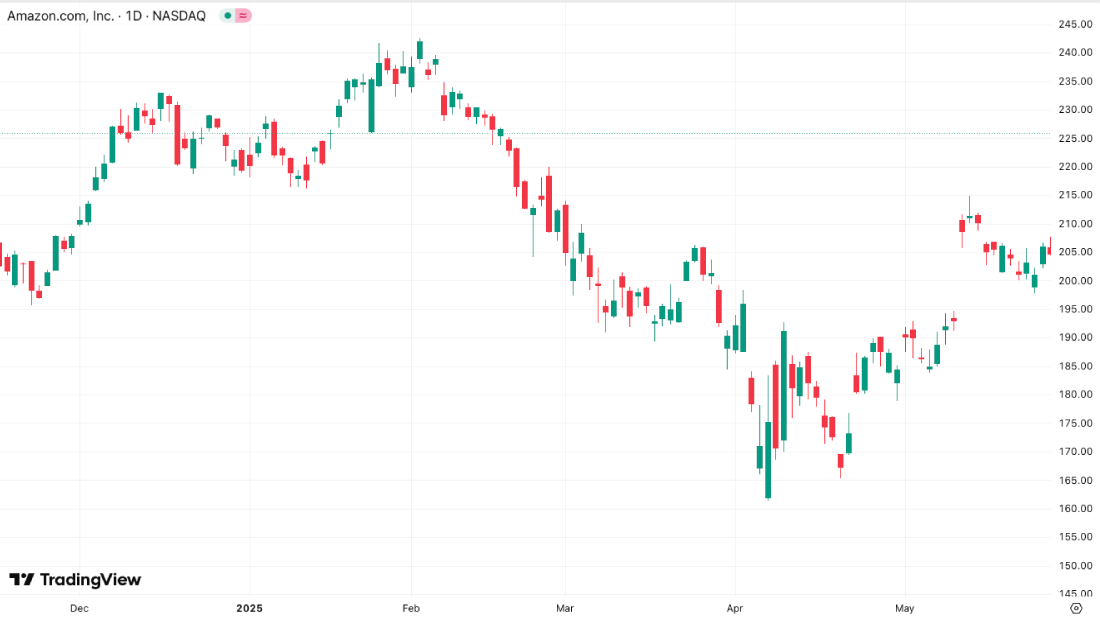
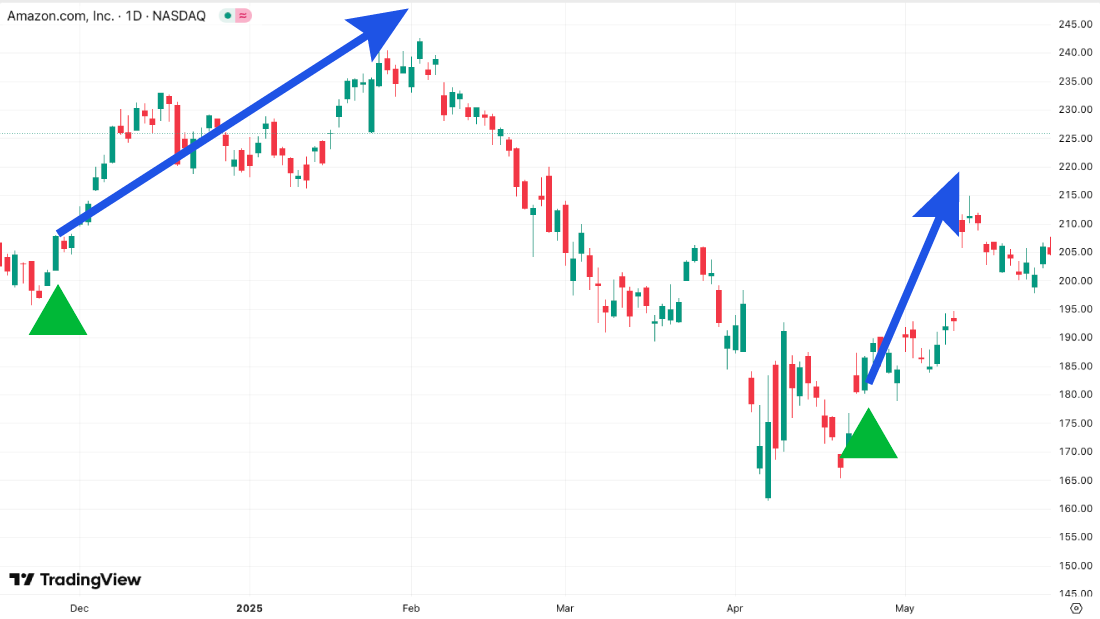
Amazon in October of 2024.
Let’s pull it up now.
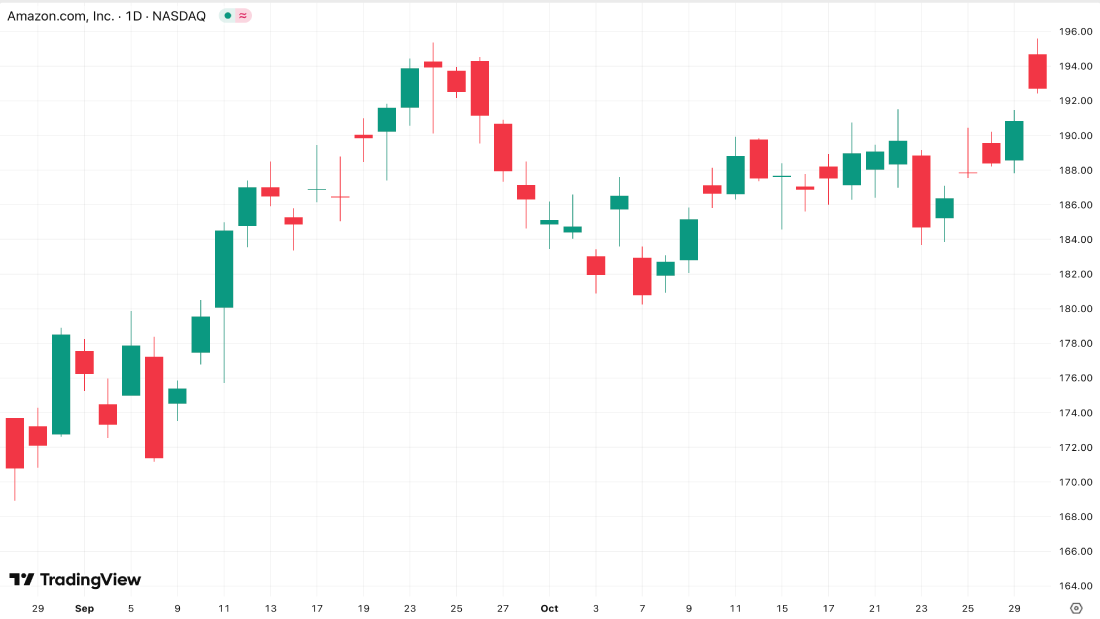
Once again...
You see a drop...
But where is the best place to get in?
Now for the arrows...
There... do you see it?
Green arrow.
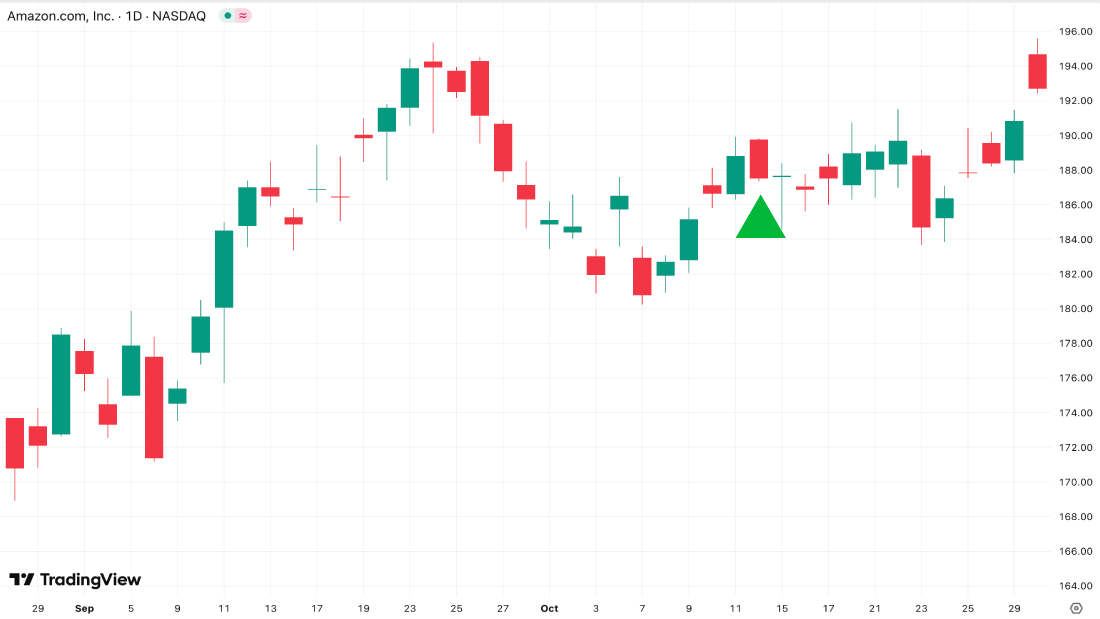
You don’t have to worry about news... earnings... ratios... fundamentals.
All you need to know is the green arrow means momentum is now positive for Amazon.
The result?
The stock shot up 26% within three months of the green arrow.
But the option?
It went up 281%!
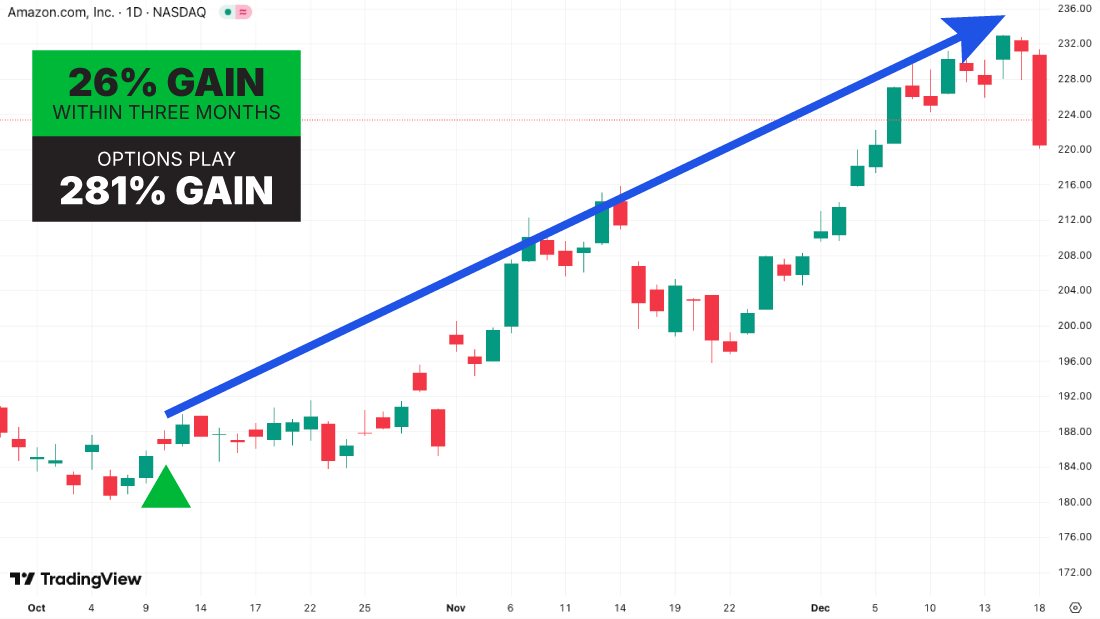
That’s 16.5 times higher!
And it doesn’t stop there...
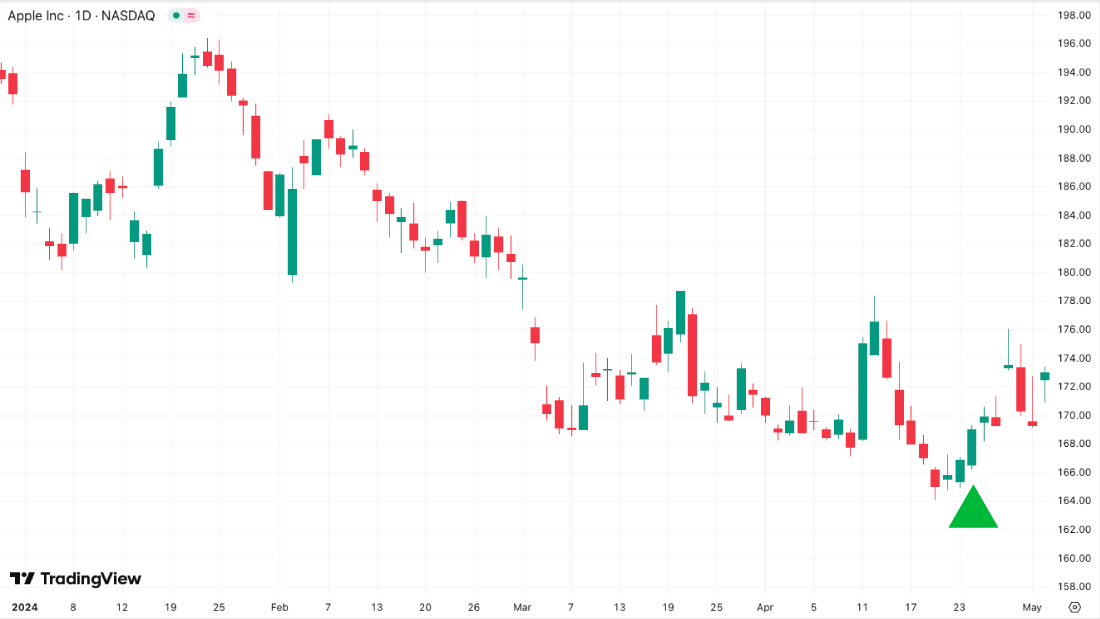
Let’s zoom in to Apple in April of 2024.
You can see the stock was going down, down, down.
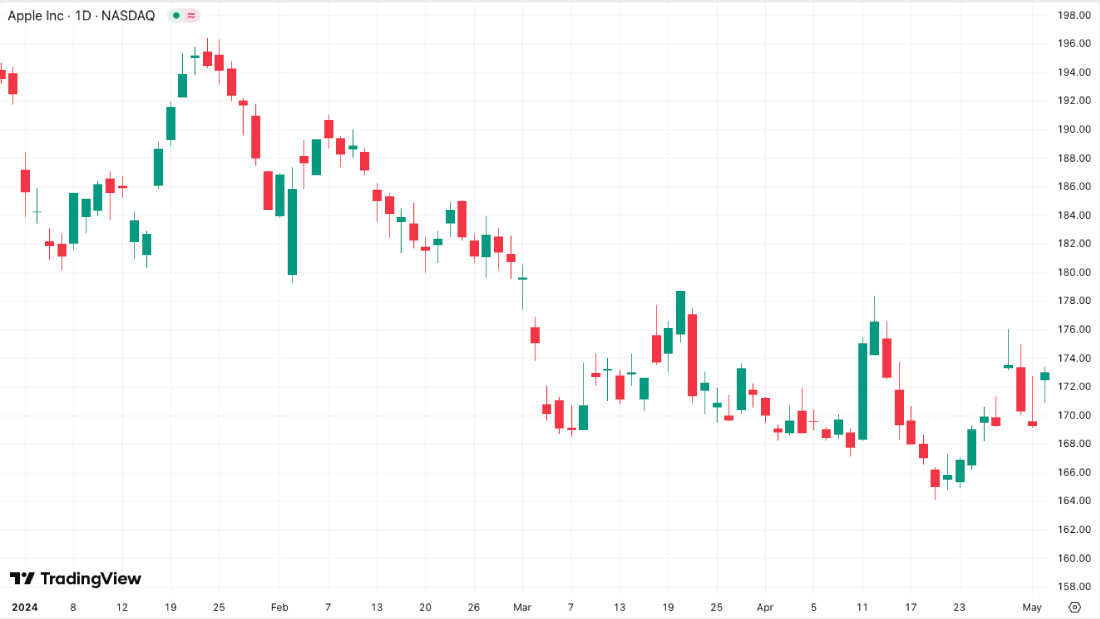
Momentum was not on our side.
But when would it reverse?
Was this a good time to buy?
That was the question every investor was asking themselves....
But there’s no way to know the answer looking at the chart by itself.
So, let’s see what the “Perfect Timing Indicator” says....
Let’s turn it on...
And just look... Green arrows!
What happened after the green arrows appeared?
Let’s take a look...
As you can see... just as expected...
The stock reversed... and momentum began.
In fact... after the green arrow appeared...
The stock went up as much as 31% in just three months!
But as I’m sure you can guess...
The options went up much more.
In this case... they went as high as 432% in that same timeframe!
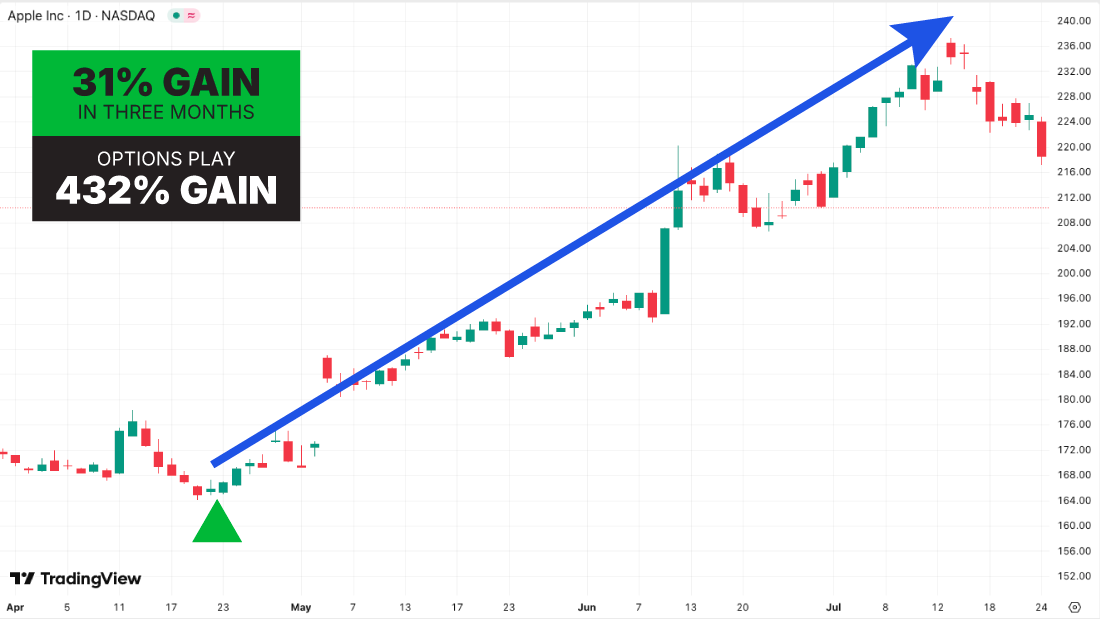
That’s 13 times bigger!
And these are just a couple examples...
Let’s rapid fire a few more:
Ok you should see it now...
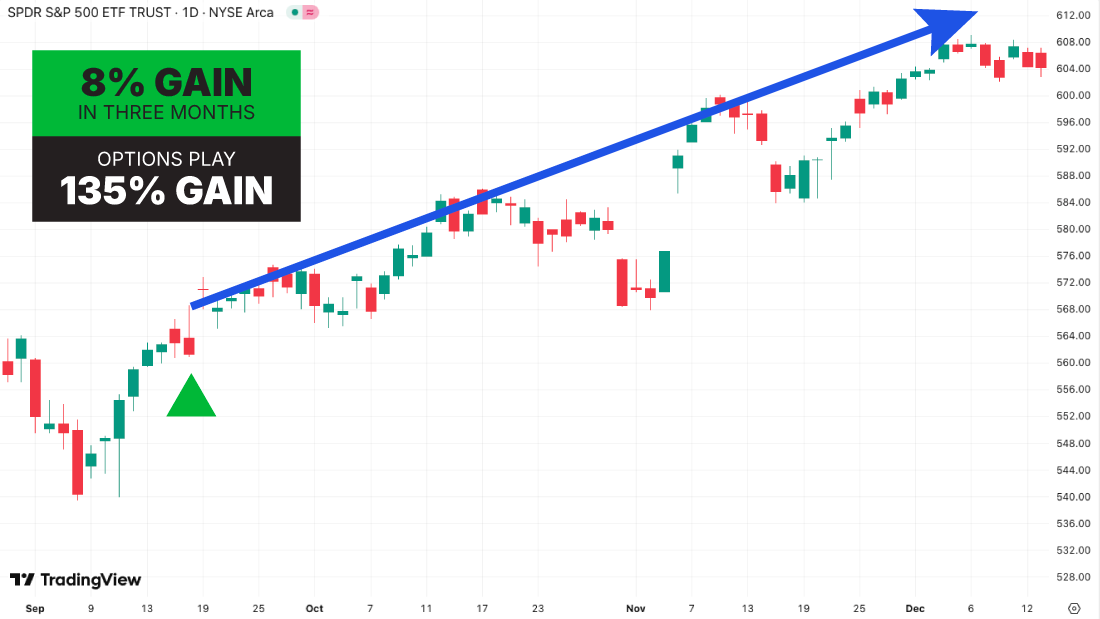
Look... the S&P 500 in September 2024.
The green arrow appears.
And sure enough, we see th index moved as much as 8% over the next three months.
This is big for the entire S&P 500... but a smaller move for us.
And yet, the options still went up as much as 135%!
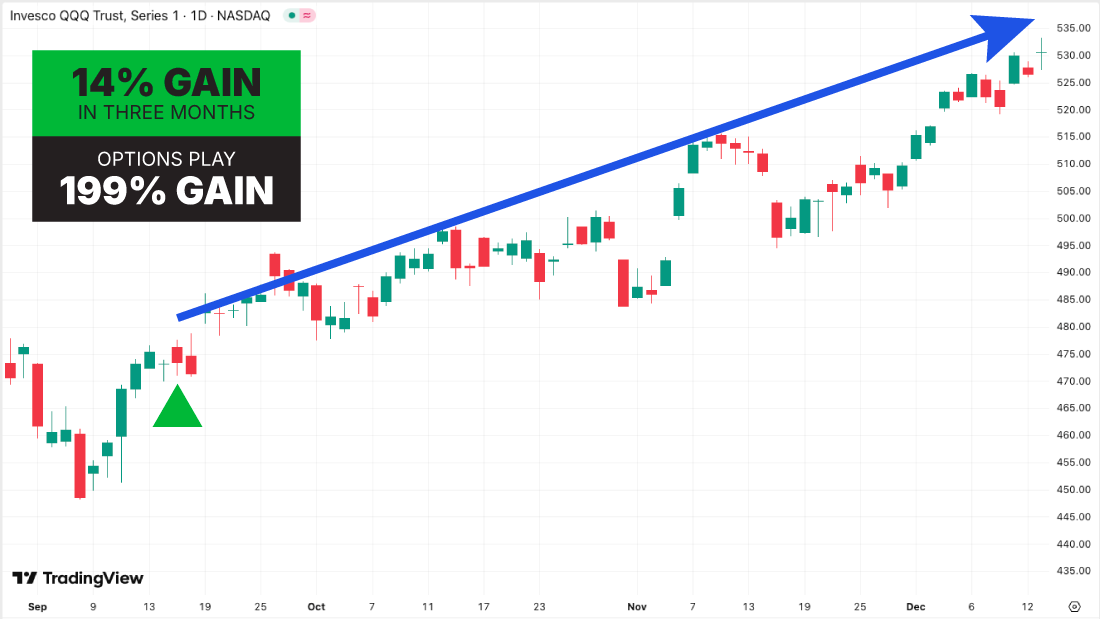
The Nasdaq, same time frame...
The index moved up to 14%... but options moved up to 199%.
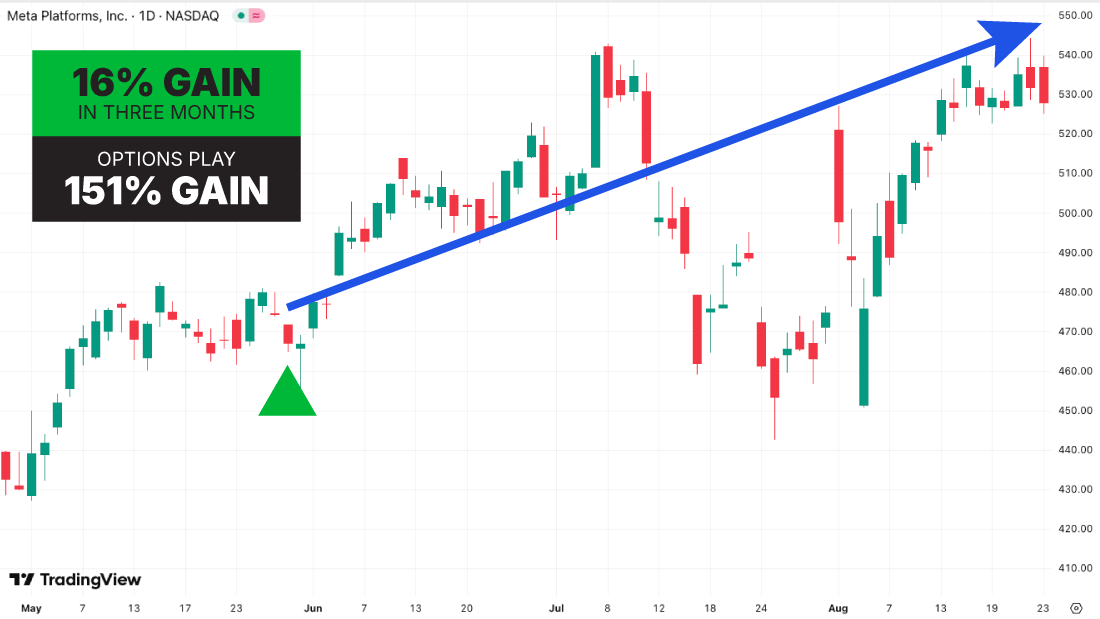
Meta... also known as Facebook... Green arrow popped May 2024...
Within three months... the stock moved as high as 16%...
Options moved up to 151%.
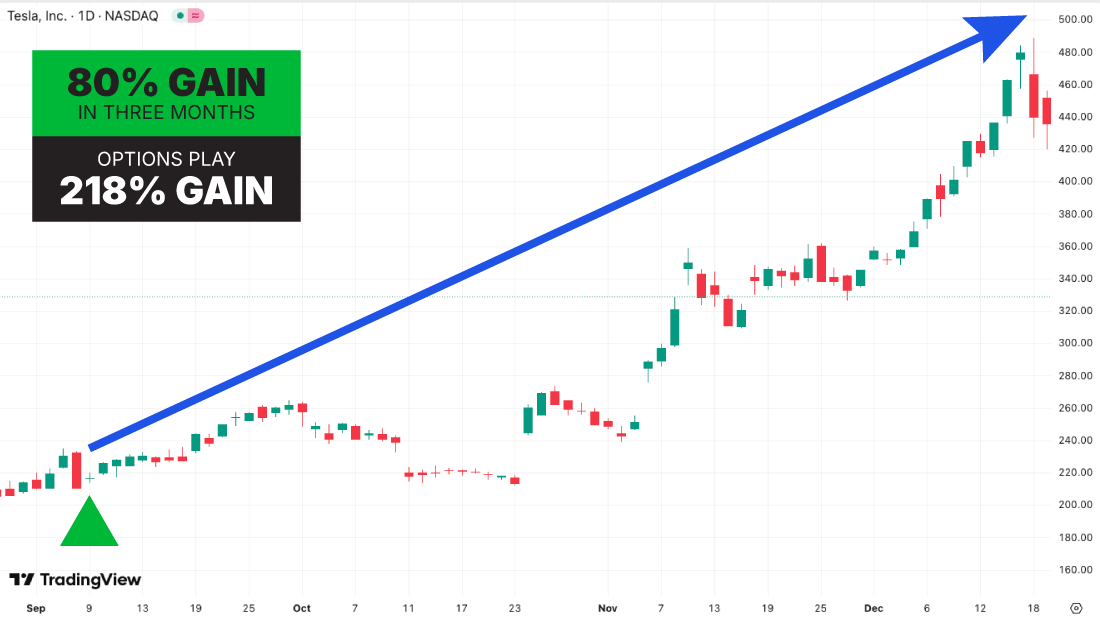
And then Tesla in September 2024...
Green arrow appears.
Stock moved up to 80%... Options moved up to 218%.
So as you can see...
Combining the Perfect Timing Indicator... with opportunities for big short term moves...
And then coupling that with the power of options...
It’s a money-making opportunity like no other.
But that’s just scratching the surface of how The “Perfect Timing” Indicator could help find big gains in a short amount of time.
Ride Wave After Wave... Green Arrows Preceeded 1,600% Total Gains Since 2023!
Now... what you’re about to see is the most exciting part of the presentation.
Basically everything we’ve covered so far is to get to this right here.
You’re going to love it...
So the fact that you are still with me... trust me it’s going to be worth it.
First... Let’s go back to Netflix.
Ok... Here’s the chart.
It’s from 2023.
As you can see...
It’s the same story we’ve seen before.
The stock was zooming up...
How would you know when to buy... so that you’re not the last sucker buying at the exact high?
Time for the Perfect Timing Indicator to show you the way...
The green arrow appears in October right at the bottom.
Now... let’s zoom out.
From that one green arrow...
Netflix went off like a rocket.
In fact... if you bought at the one green arrow in October...
The stock surged as high as 184% since then!
Now that’s terrific...
But you may have noticed...
There are OTHER green arrows as well.
Look...
There’s the rally after the first one...
Then a pull back...
Then a second green arrow.
Then the stock goes up again...
Hits another dip...
Then another green arrow.
In all...
There are five different times the stock has momentum.
And green arrows appear... and the stock goes rocketing up.
So now... I can show you how to unlock the real value of the “Perfect Timing” Indicator.
Instead of just buying and holding the stock through the ups and the downs...
You could choose to buy options when there’s a green arrow... and use the three month sweet spot to go for bigger gains... faster.
So let’s see how that would have played out with Netflix if someone got in options for every single one of these arrows.
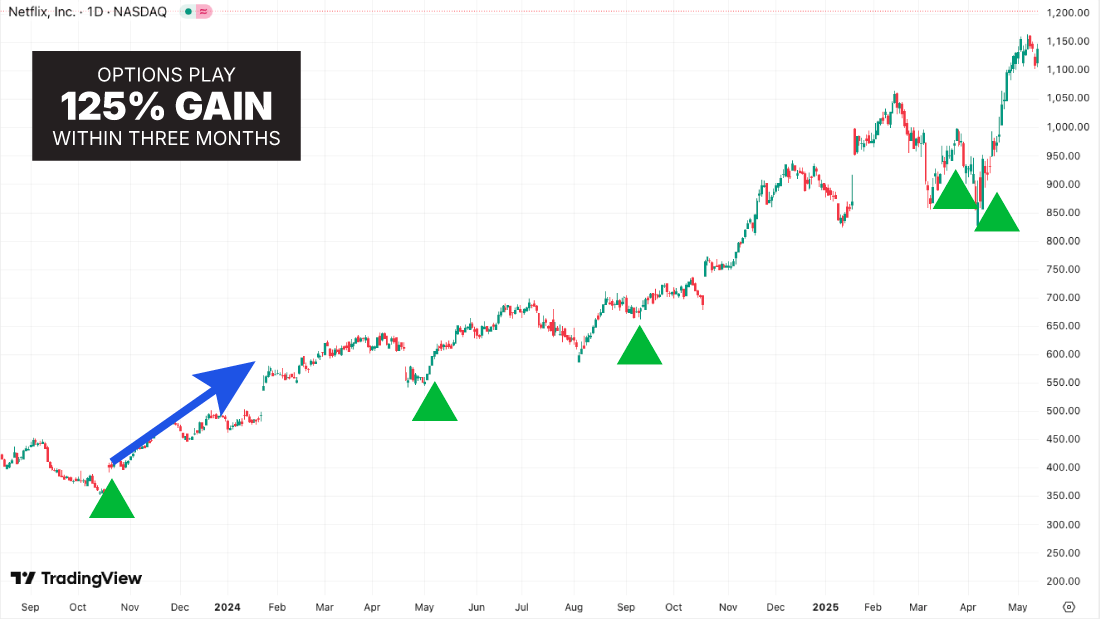
First up...
If someone bought an option on Netflix after the first indicator in October of 2023...
Those rose as high as 125% within three months.
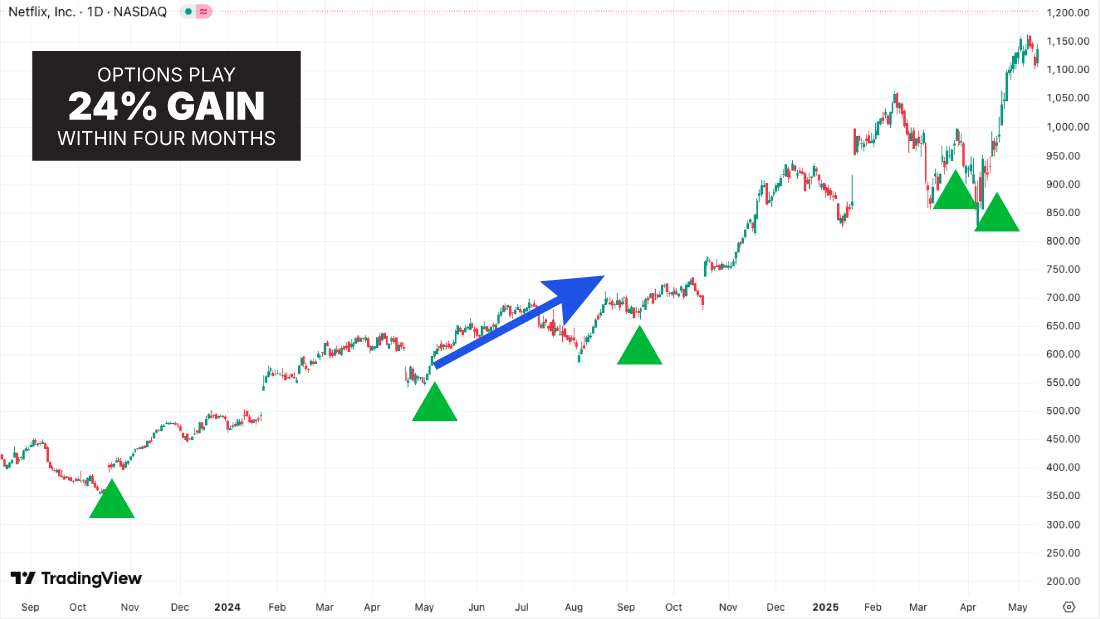
Then... there’s the May 2024 signal...
Options on Netflix rose as high as 24%.
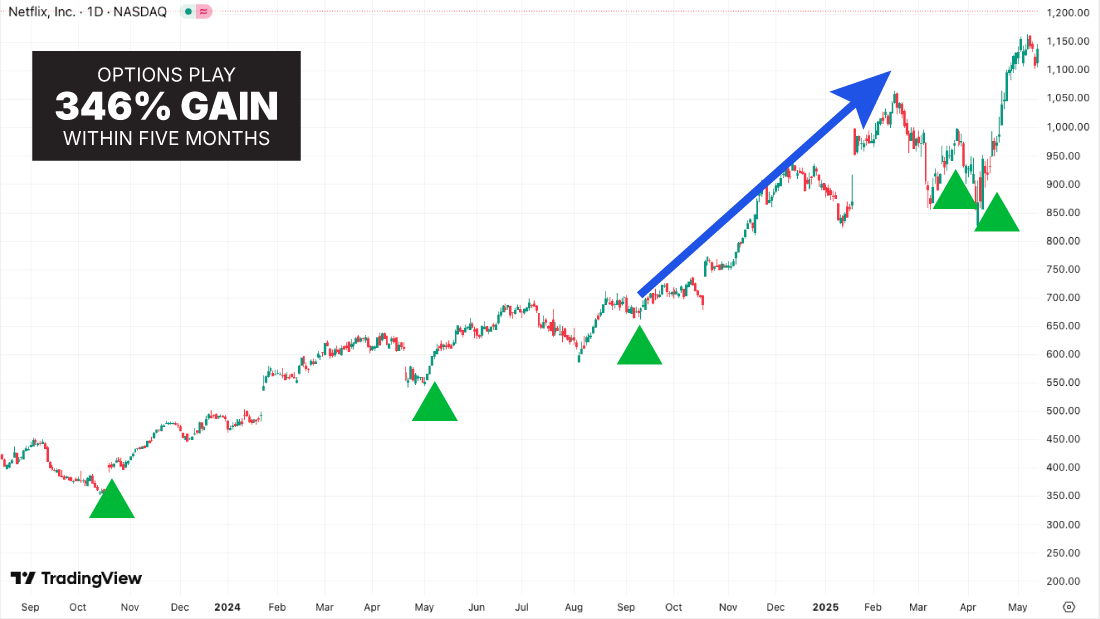
Then the September signal...
Options rose 346%!
And the fun didn’t stop there...
The March signal preceded options gains as high 231%...
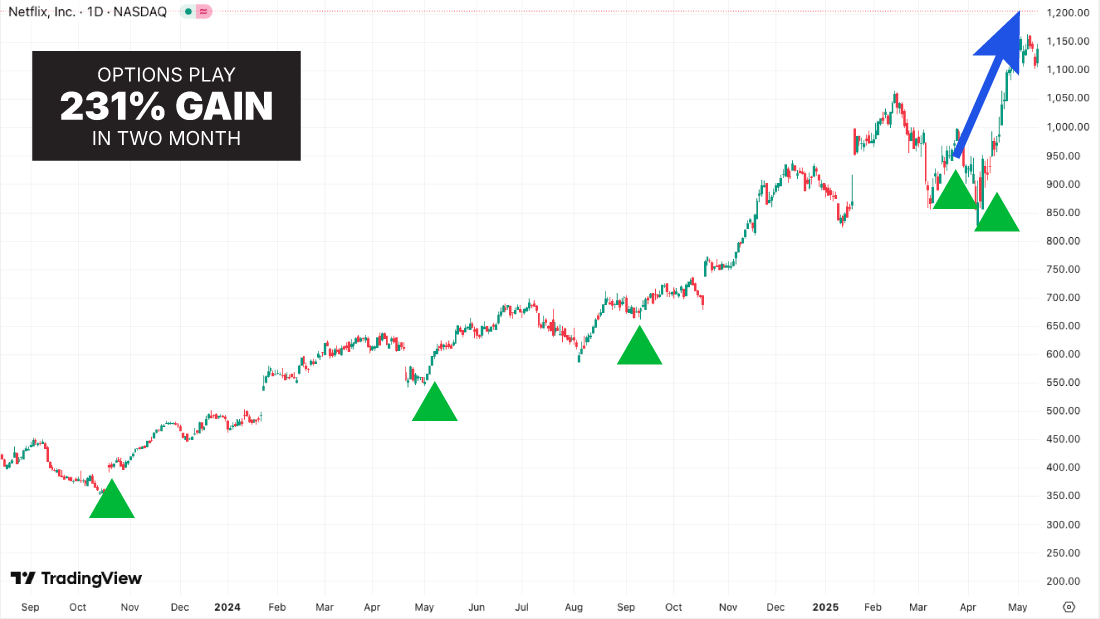
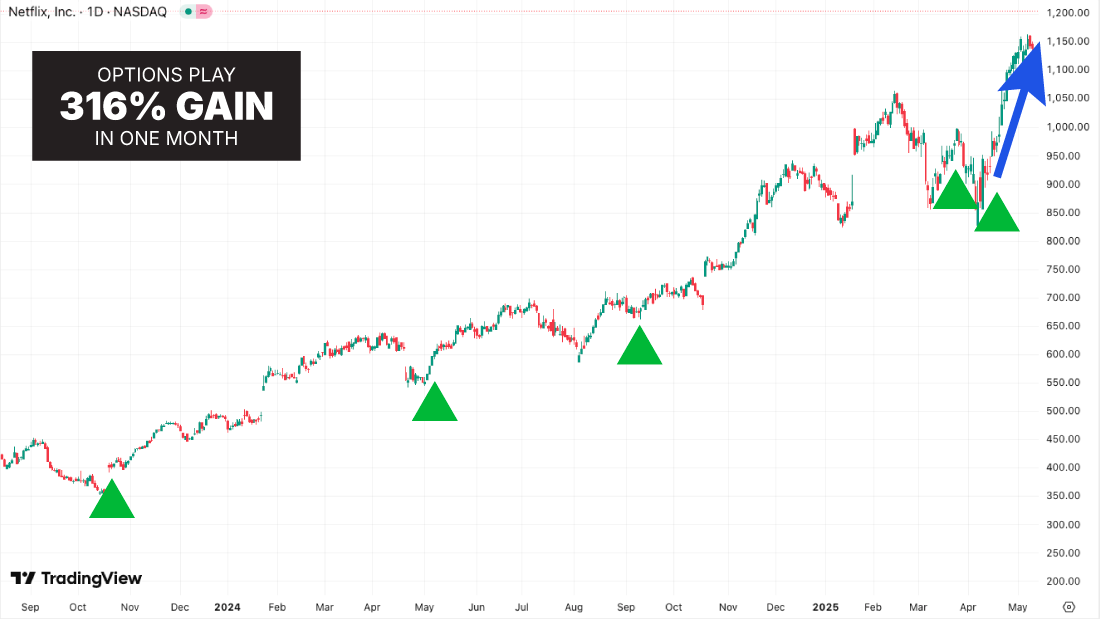
And then the April signal flashed right before options gains as high as 316%.
Don’t forget...
That’s holding the options, on average, for three months.
These five arrows preceeded options moves that added up to as much as 1,611% on just this one stock!
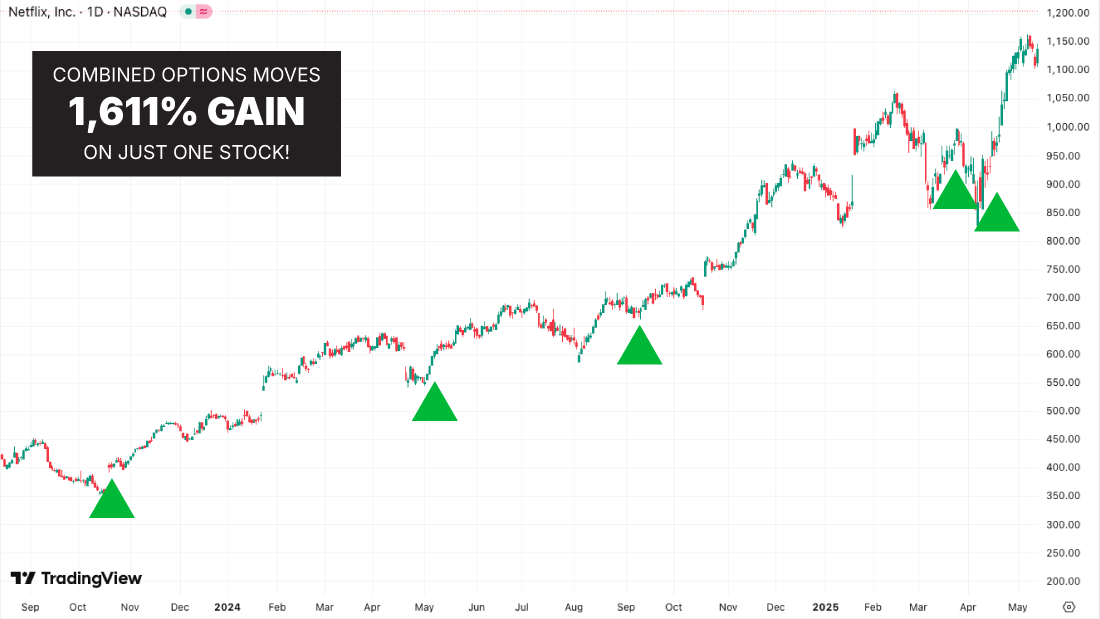
It’s enough to turn $500 into over $8,500...
$2,000 would grow into over $34,000...
And $10,000 would explode into over $160,000!
Now... of course this is a best case scenario where the stock went up after every single arrow.
Making back-to-back triple digit gains is certainly no easy feat.
I just wanted to show you the power of buying options at the green arrows...
And how these returns can leave traditional buy and hold investing in the dust!
But keep in mind...
This doesn’t have to be either or.
You could use this indicator to know when to buy more of the stocks you love.
And ALSO add options to boost your returns.
It’s completely up to you.
Ok... so that paints a picture of the power of the Perfect Timing Indicator...
I’ve shown how it can help with long term investing...
Figuring out when to buy the dip...
And I’ve shown you how this can actually work for short term trading as well.
But... I’ve trained enough people to know the questions that are running through most people’s minds...
So let me tackle three of them right now.
How Can I Know When a New Green Arrow Appears on a Stock or ETF I’m Watching?
Obviously... if a new arrow shows up...
Of course you are going to want to know.
So... I’ve found a way to program TradingView to send out an alert any time there’s a new green arrow.
Let me show you how it works.
Let’s say you are thinking of buying Netflix stock.
Here’s how you would set up the alert.
All you do is do a couple buttons here...
And it will set an alert.
You can do this for multiple stocks that you want to own... but are still wondering...
Is NOW the best time to buy?
So you turn the indicator alerts on for those stocks.
And then it will only alert you when those stocks, ETFs, indexes, etc have green arrows signaling a buy signal.
You get the alert.
And then, if it’s a stock you love, then you know that momentum is on your side to make your decision.
The next question involves timing...
How Far After an Arrow Appears Can I Still Buy?
For the examples that I’ve shown you...
I’ve been focused on the Daily charts.
My advice is... if you are using the Daily time frame...
You want to be within a few days of the green arrow.
Plus... you want to look at the price level the stock is trading.
If it is significantly higher than when the green arrow appeared...
You might want to pass on the trade.
This is why I tell you to not just automatically buy based on a green arrow.
You want to do some common sense thinking first.
Bottom line...
This is a tool...
Don’t just blindly buy every green arrow.
A green arrow doesn’t guarantee a gain. As we all know, nothing can be guaranteed in the world of investing, so never invest more than you’re willing to lose.
You should also make sure it’s a stock you want to own. And make sure the price hasn’t move dramatically from when the arrow first appeared.
That brings us to the last question that I’m sure you are curious about.
Is There Anything to Help Decide When It’s Time To Exit?
Now... remember...
These green arrows are meant to show you when momentum is on your side.
Many of you may choose to use this to simply buy stocks you love...
And that may mean you want to hold these stocks long term.
You may not ever want to exit them... unless something changes about the fundamentals of the company.
However... if you do want more short-term trades...
Here’s something that could help you.
Let’s bring up a chart on Amazon again...
Just looking at this chart... you would probably thinking “there’s no way to know if it’s going higher or lower...”
And that’s exactly why we use the “Perfect Timing Indicator”!
Let’s turn it on... and you can see for yourself...
There were two green arrows there.
Sure enough... the stock went up after the first arrow...
And it’s gone up after the second arrow too.
But let me show you something truly special about the “Perfect Timing” Indicator.
It actually can work in reverse too!
I go right here...
Click on the red box.
And boom...
Now you have not just green arrows...
But RED arrows too.
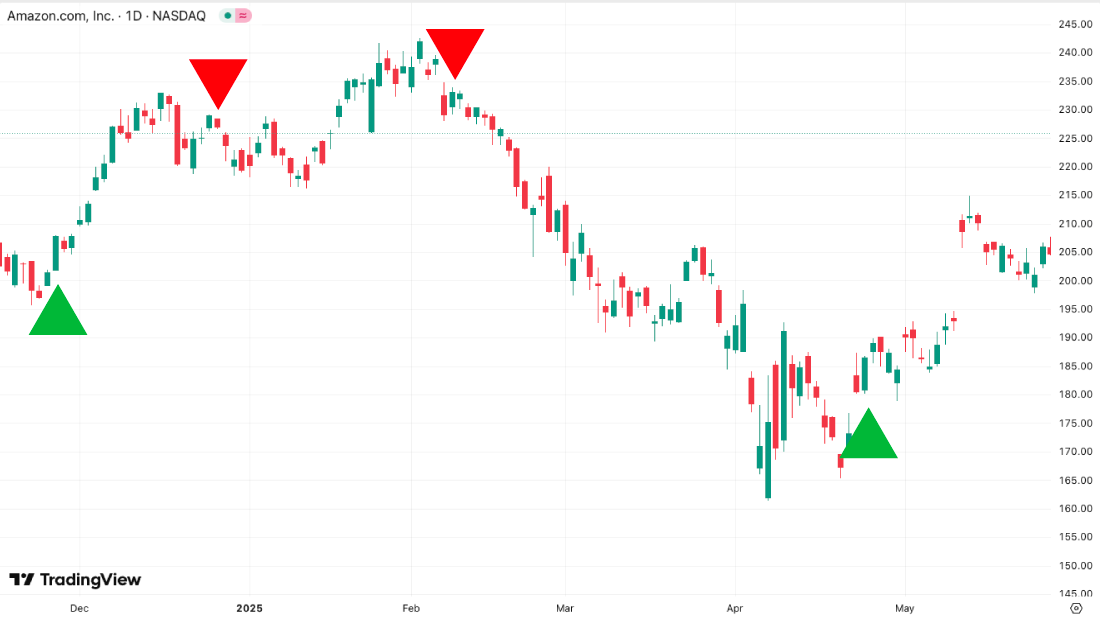
This feature tells you when the party is over... and the momentum has stalled in the stock.
Again... if you are focusing more long term... you might not care if momentum has stalled.
Maybe you’ll just wait for the next green arrow to buy even more!
But if you are going for more short term trades...
Knowing when the momentum has stalled could be a good indicator it’s time to exit.
Again... this is a tool...
How you use it... is completely up to you!
So by now... I’m sure you are ready to get the code for yourself...
That way you can immediately add it to your own charts and start watching for the green arrows on your favorite stocks, ETFs and indexes.
And... I’d like to show you how to get it 100% FREE!
It’s all in my report:
The Perfect Timing Codebook: Copy/Paste This Code to Identify the Best Times to Buy Stocks
Inside this report is the exact code you need to copy and past into TradingView.
I’ll email it right to you... you can have it within minutes.
That way you’ll have the exact 39 lines you need... you simply follow my instructions and plug it in. From there, the rest is up to you!
Inside my report is a video tutorial that will walk you through every step of the set up and functions.
You can see me install it every step of the way so its nice and easy for you.
But listen... I don’t want to just give you the code and send you on your way.
My team and I spent the last six years of my life helping turn regular investors into experts at extracting money from the markets.
We want to help you do the same.
Which is why... We’re sending my Perfect Timing Indicator (for free) to new subscribers of our weekly livestream – Catalyst Cash-Outs Live.
You’re Personal Invitation To Our Livestream: Catalyst Cash-Outs Live
As I said at the beginning of this presentation...
Above all else... I’m a teacher.
I want to help people just like you discover the wealth-building power of the stock market.
I want you to achieve your financial dreams...
And have the lifestyle you deserve.
This isn’t about making a fast buck for me.
I don’t want to just sell you the indicator and send you on your way.
I want to actually HELP you all year long.
That’s why I want you to take a risk-free look at our weekly livestream service: Catalyst Cash-Outs Live
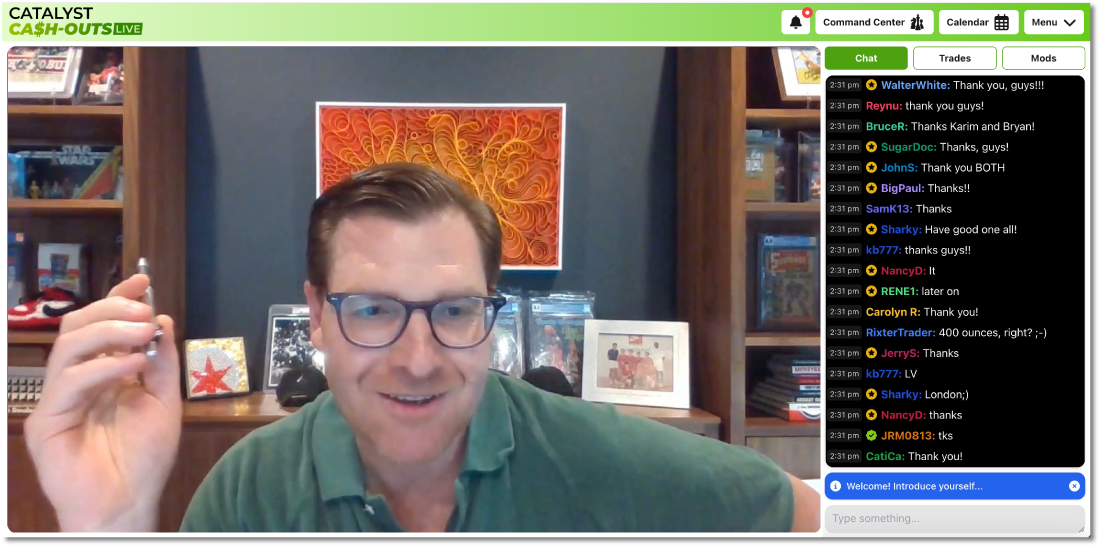
Every single week... on Tuesday at exactly 2 p.m. my team and I go live.
We discuss the stocks in our portfolio, what’s going on in the markets...
Why stocks are moving up and down... what sectors offer the best opportunities...
What new trade opportunities we see... and more.
We can’t give you personalized advice...
But we give out weekly trade recommendations on the very best opportunities we see in the market.
As well as our full profit plan.
Made Millions From ONE of Our Recommendations!
One of our happiest members actually became a millionaire with just one of our best recommendations.
Here’s the story...
We saw a major opportunity in Rolls-Royce.
No... not the car company.
Rolls-Royce actually sold its car division to BMW years ago.
Today, Rolls-Royce manufactures aircraft engines... and modular nuclear reactors... among many other things.
Back in 2022, we saw Rolls-Royce was inexpensive... trading for less than $2.
Because of COVID... aircraft travel had dropped like a rock.
And it hurt Rolls-Royce’s stock... because they get paid per flight-hour and the bulk of their revenue comes from maintaining their aircraft engines.
So... no one was talking about the stock at the time.
Which made it an incredible value.
In fact, we called it “The Last Great Value Stock,” because we were so blown away that such a great company was trading so cheaply.
And we knew the stock had nowhere to go but up.
Since travel restrictions had been lifted, the company was set for a major momentum reversal.
And that’s exactly what happened.
Just look:
Once positive momentum kicked in, the stock went on a non-stop rocket ride to the moon.
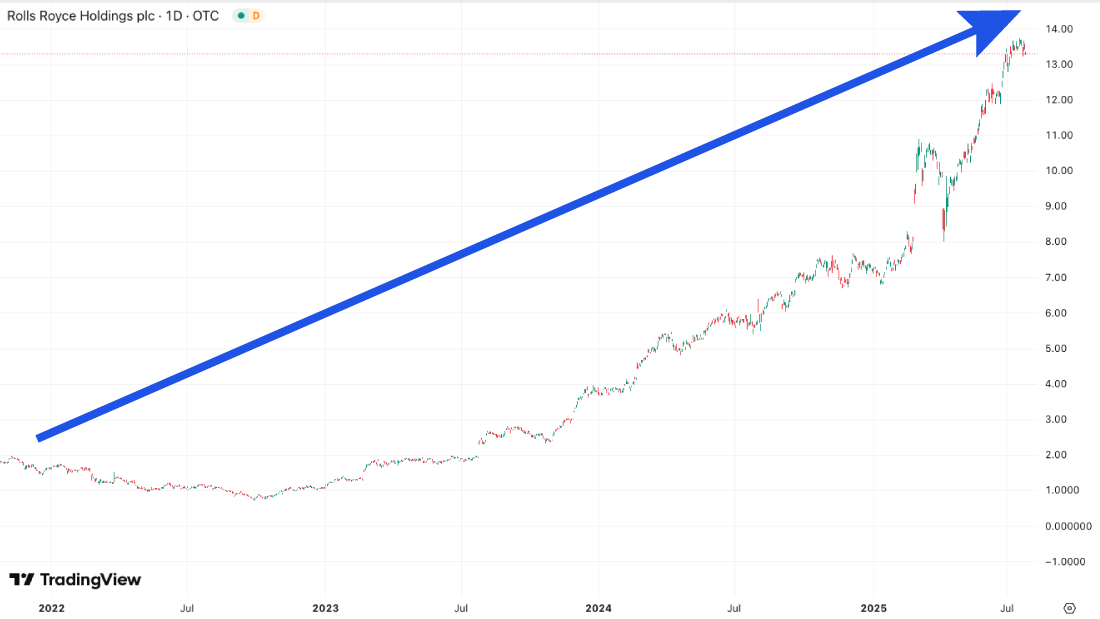
Over 14,000 people received our recommendation on RYCEY, the ticker symbol for Rolls Royce.
Our readers beat everyone in...
And the stories I heard from some of my happiest readers are incredible.
We got a note from one of our followers named Timothy.
“About three years ago I watched a video talking about stock symbol RYCEY. I started investing with about 20K and the stock was at .88. Today it is at $7.48 and I have made several hundred thousand dollars in profit. My account now stands with this stock over one million dollars. I just want to say thanks!!!!! It has been life changing.”
Our follower Carl sent another note.
“I did sell most of my 37,000 shares of RYCEY. My wife and I used the money to pay cash for our retirement home in Texas.”
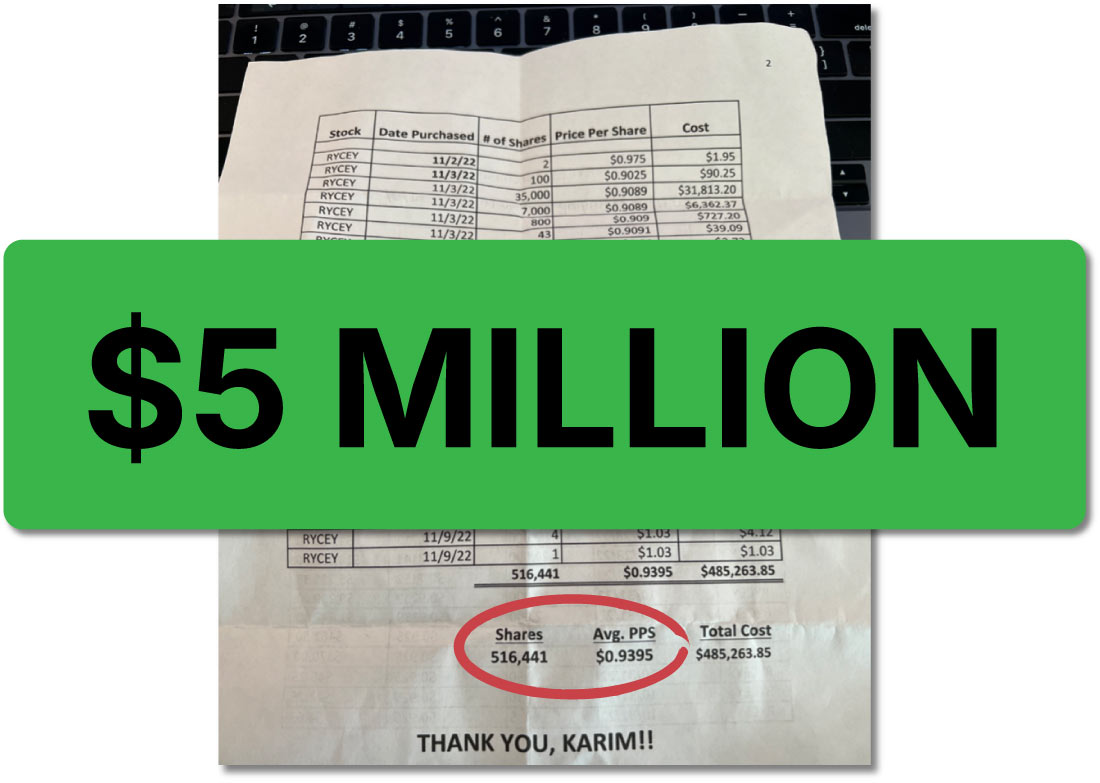
But perhaps the most interesting one was this piece of paper one of our followers brought to one of our conferences.
It was a printout of his trading account.
This guy had bought 516,441 shares of RYCEY at an average of just 93 cents per share.
At today’s price over $10, those shares would be worth over 5 million!
Now... here’s what’s really cool...
Let’s look at Rolls Royce’s chart again.
And now let’s click our Perfect Timing Indicator...
Boom!
The green arrow would have been there way back in 2022 when we originally recommended the stock!
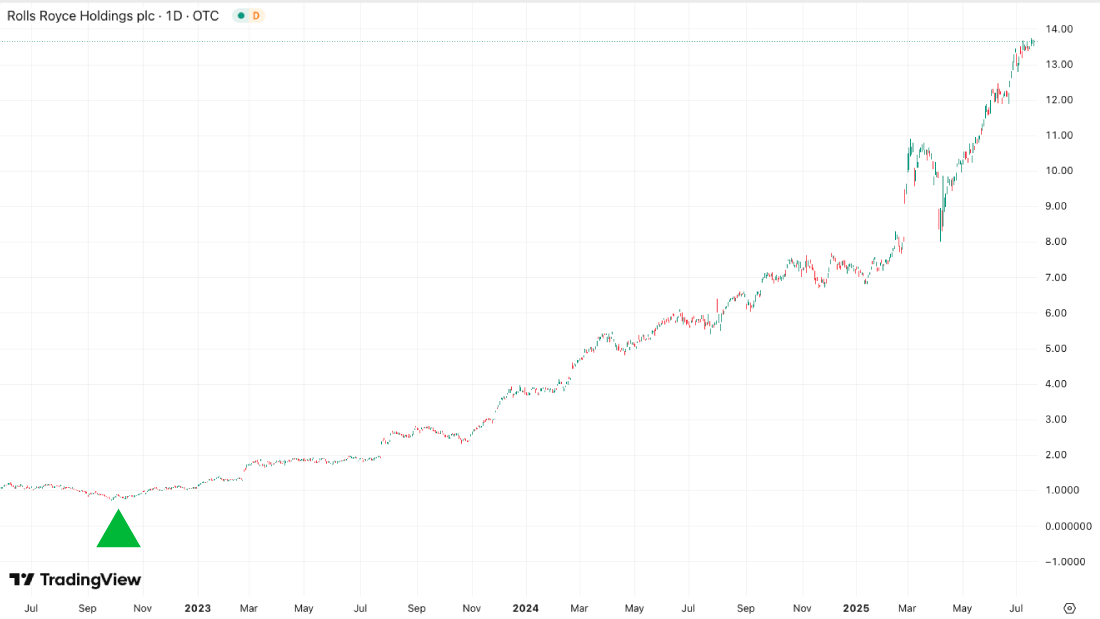
And it indicates opportunities to buy during the dips along the way.
It’s yet another example of the amazing power of the Perfect Timing Indicator.
For buying and holding a great stock over the long term...
To buying a stock for short term...
And even options...
Nothing beats the incredible power of this tool.
That’s why I want to rush you a copy of my report: The Perfect Timing Codebook: Copy/Paste This Code to Identify the Best Times to Buy Stocks”
I want you to see these green arrows for yourself.
And don’t forget... you get it FREE as a new Catalyst Cash-Outs Live member.
But that’s not all I want to send you.
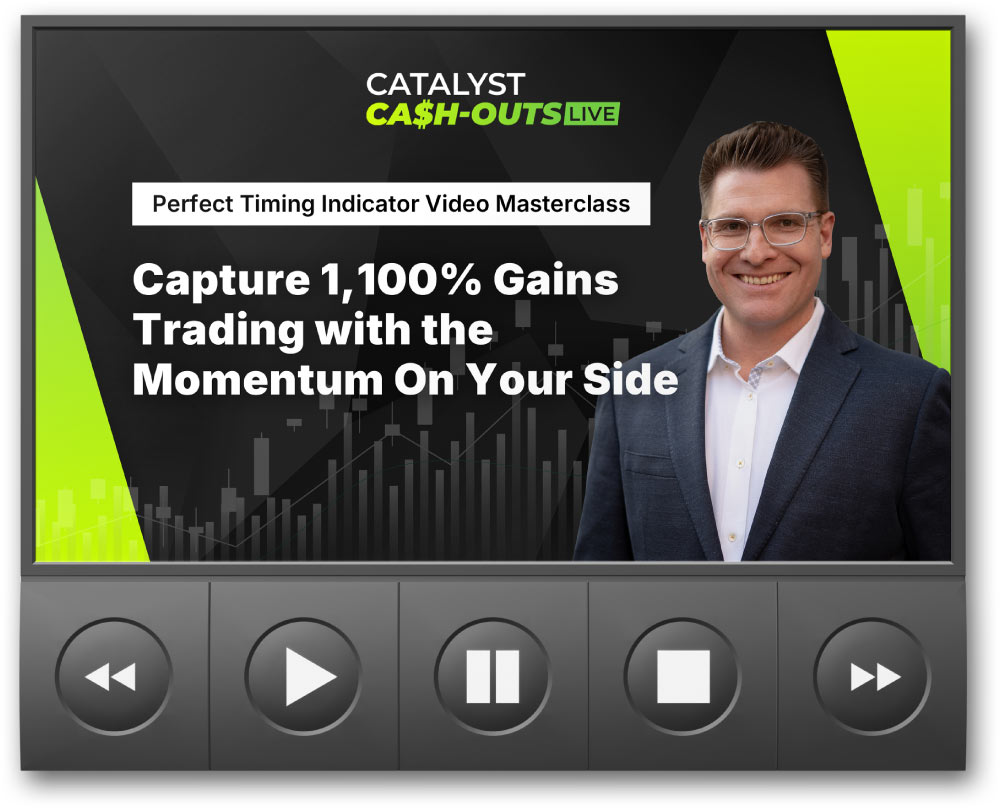
I’ve also put together a full video library on how to use the Perfect Timing Indicator:
Perfect Timing Indicator Video Masterclass: Capture 1,100% Gains Trading with the Momentum On Your Side
I cover everything you need...
From opening a TradingView account...
To getting the green (and red) arrows loaded in your charts...
And even different ways to use the indicator to help your trades.
Here’s all the videos we have for you:
- Full Step By Step Tutorial: Setting up your TradingView Account and Installing the Perfect Timing Indicator: We’ll walk you through step by step so you know exactly how to get your account setup as well as see all the arrows for the indicator.
- Buy and Hold: Strategies for Using Green Arrows for Long Term Investing: We’ll show you all the ways you can use the green arrows to help your buy and hold strategies. These are for the stocks that you love and you want to hold long term. We’ll even show you how trading green arrows over time can potentially help you average into a stock, and reduce your cost basis.
- Short-Term Strategies: Using Shorter Time Frames to Go for Faster Gains: We’ll go more in depth on trading during the “sweet spot” of three months. That way you maximize the power of momentum. The goal is to make the gains as fast as possible.
- Using Options to Maximize Your Gains: We show you how to use the power of options to potentially make even bigger gains during the three month sweet spot.
- Exit Strategies: Profit Targets, Trailing Stops, Selling Half: We show you all the ways you can manage your trades. From using trailing stops to preserve your profits... as well as taking part of your gains off the table.
- Bonus Training: How To Turn Falling Stocks Into Big Gains With Red Arrows: In this bonus lesson... we reveal how to use the red arrows as a chance to make money off of falling stocks. From using hedge trades to preserve your portfolio... to making money when the market is going down... this is a real Pro Trader strategy that can help you win in ANY market environment!
And again...
This entire Master Class is yours FREE as a new Catalyst Cash-Outs Live member!
But that’s still not all.
Because I want to give you a full resource on trading options the RIGHT way.
I have a simple blueprint to get you up to speed fast:
The Pro Traders Options Guide
This guide makes trading options as easy as buying a stock.
You’ll learn the right way to trade options... and how to avoid all the newbie mistakes.
We’ll show you how to set up an options account if you never have before...
The basic terms used in options trading...
And everything else you need to know about trading options.
Again... even if options are intimidating to you right now... I promise that after reading this report... you’ll know more than 99.9% of the traders out there.
And listen... during my livestream sessions each week, I’ll give you detailed instructions on which options to trade and how.
Once you learn to trade options the right way... you’ll never look at the market the same way again.
And you’ll see how easy it can be with this special primer...
Yours FREE when you join me today.
But here’s even MORE of the many benefits you’ll get by joining this new livestream service.
You’ll get Access to Our Model Portfolio, Including All Our Current Recommendations... Plus... Access to Our Concierge Team...
We have personally trained our friendly staff to quickly answer any questions you have regarding your membership...
And our moderators are trained to answer any general questions you have about our trading strategies and techniques.
Now... of course they can’t give you personal investment advice... but I’m sure you know that.
But because we are LIVE... we can help you right away with anything we are covering.
However, if you don’t have time to jump in the session live don’t worry...
You’ll Get Every Trade Delivered Directly to You Through Our Trade Alert System
We also have our Trade Alert System set up to get you every trade the moment we recommend it.
Whenever we recommend a new trade, it will instantly be sent to you with simple instructions how to make the trade, along with our analysis.
That way you never miss an opportunity, even if you don’t have time to join our livestream.
And when we close out a trade... you’ll also get a sell alert with exact instructions.
Our goal is to make things dead simple for you.
Our job is to find the great trades... your job is to rake in the win
Bottom line...
I’m giving you EVERYTHING you need to succeed in the markets.
Not just the indicator (which will change how you trade forever)...
But also a weekly livestream...
And live access to our moderators and our trading research community.
We’ve helped thousands of people just like you learn how easy it is to generate money from the market.
But...
You don’t have to take my word for it.
People Just Like You Are WINNING...
Look... I learned 20 years ago trading in the Live Pit of Chicago...
Talk is cheap.
What counts... is results.
And so that’s what I want you to judge me on... results.
That’s how our current subscribers grade my performance. Just check out
some of our top success stories!
Eric O. wrote to tell us...
“Thanks for great recommendations.... I am up 45% at this time [on one play in one month]. An easy $4K profit today.”
Then there’s Pamela S., who bought our Rocket Companies recommendation.
She said she...
“Cleared a 60% profit” in one month.
Our Hertz trade was another one. We closed it in one month... with a total return of 50%!
Readers were thrilled...
Daniel T. reported being up 67% in one month...
John R. landed a 52% win in one month...
And Erik K. bought it... told us he was busy and rarely checked his account... and then opened it to see a 79.5% win in two months!
Seeing people succeed and understand how life-changing it is to be a successful trader is all the reward I need.
Our recommendation on Jasper Therapeutics in October 2021 is a good example.
We recommended it on the 7th, and by the 13th, we were up 50%.
Peter H. said...
“Watched your video over the weekend, bought it yesterday at $8.14. And it’s OMG today.”
And take a look at Geno, who played one of my recommendations on the stock SOFI.
He made a 156% profit within a day thanks to an option play!
If you haven’t experienced big returns in your portfolio that fast...
It’s time you changed that.
A whole new world of possibilities opens up for you.
By now you are probably ready to get the code... and get the green arrows on your charts.
How To Get Started Using The Perfect Timing Indicator... and Join Us in Our Next LIVE Session!
As I said before...
This isn’t about a quick buck for me.
I could easily charge $1,000 for the Perfect Timing Indicator alone... with NO weekly guidance.
It would still be worth it to be able to evaluate any stock, ETF, Index – even Crypto.
But I don’t want to just sell you a tool and send you on your way.
I want you to help you week by week...
So when you combine the weekly livestream, all the bonuses... and the Perfect Timing Indicator...
Our publisher thinks the retail price of $997 is far too low.
But look...
Because I want to PROVE to you that I’m the real deal... and that my livestreams can truly make a difference in YOUR life...
I’m extending a special discount to you.
If you say YES right now...
You can get a full year’s access to Catalyst Cash-Outs Live...
For JUST $49.
That’s all.
That’s less than $1 a week for our livestream.
It’s a steal, honestly.
That’s why it’s ONLY available right now to our new members.
Click on that button below to subscribe...
You’ll get the Perfect Timing Indicator for FREE...
And you can join me for a YEAR of weekly livestreams and our BEST trade recommendations.
And rest assured...
This is truly a risk-free proposition for you...
To make this as easy as possible for you, I’ll give you an entire YEAR of Catalyst Cash-Outs Live to review everything risk-free.
If for any reason Catalyst Cash-Outs Live isn’t for you... simply call our VIP Concierge Team within 365 days and they’ll refund your subscription entirely.
No questions asked!
Plus, even if you do cancel, you can keep the Perfect Timing Indicator (and every other report and video) at no charge whatsoever.
In short, you can sign up... get the code for The Perfect Timing Indicator...
You can install it into your charts... and use it forever.
Even if you change your mind over the next year... I’ll give you your money back.
And you can still use the indicator...
You’ll keep all the training videos... and all the special reports.
That’s how confident I am in the work I do... and the success I’ve had teaching people.
And...
There’s one last bonus I want to give you.
I mentioned that Rolls Royce was one of our BEST recommendations.
Remember the one guy who made MILLIONS on just that one stock?
Well...
We have just recommended another stock that I think could be our NEXT big winner.
This company is what we call a unicorn.
And a unicorn is simply this...
It’s a company that finds itself so wildly profitable... yet so insanely undervalued... that the share price has almost nowhere to go but up.
This is where jumps of 1,000% or more happen... sometimes in less than a year... sometimes in months... sometimes in days.
Listen, it’s rare for ANY stock to become a unicorn.
In fact, out of 23,281 publicly traded stocks, only ONE meets my criteria to be considered a unicorn right now.
Just this one.
It is raking in income like nothing else in the market right now.
In fact... this company has higher operating income than Hilton... Chipotle... Airbnb... or a hot tech stock like Advanced Micro Devices.
And yet... it trades far cheaper than any of them.
In fact, it’s about 20 times cheaper than AMD!
Out of 23,281 publicly trades stocks, this is the ONLY ONE with over $3 billion in operating income, a market cap of $8 billion or less... 15% revenue growth... and 20% dividend growth over the past three years.
Not only that, this company is at the center of two of the most important industries going forward.
Energy and AI.
It actually just formed a partnership with one of the hottest AI stocks in the entire market... Palantir.
This unicorn stock is easily the single best upside trade in the entire market right now.
You simply cannot find another company generating over $3 billion in operating income that trades for this cheap.
This is definitely not a “wait and see” stock.
Best of all...
Let’s look at the chart...
As you can see...
The Perfect Timing Indicator just flashed green.
History says that means a big move is coming.
The ticker symbol and our full analysis of this stocks can be found in our new report: “The Ultimate Stock Unicorn”
But don’t delay.
The opportunity for the biggest gains might pass you buy.
So click on the button below and join us in Catalyst Cash-Outs Live.
As a reminder...
Here’s everything you will get when you join Catalyst Cash-Outs Live...
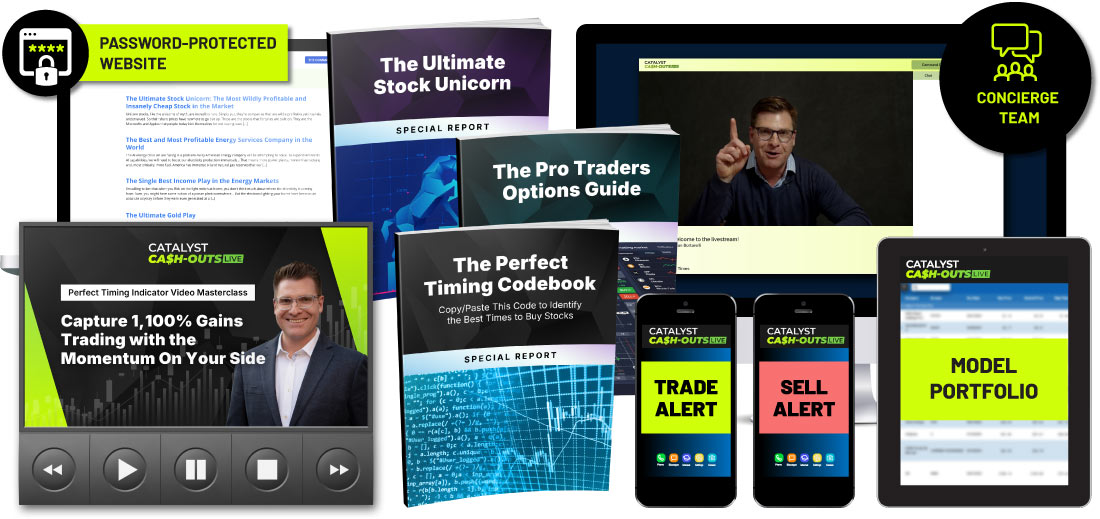
- Weekly Access to Our Livestream Trading Sessions – On Tuesday’s we go live at 2 pm to give people our best trading ideas live in the chatroom. You’ll get our favorite stocks, special overnight trades, earnings opportunities and more.
- Access to Our Trade Alert System – Any trade we recommend will be sent to you in email with complete buy or sell instructions along with our analysis. This way, even if you can’t join the livestream, you’ll still be able to act on any trade.
- SPECIAL REPORT: “The Perfect Timing Codebook: Copy and Paste This Code to Identify the Best Times to Buy Stocks”
- Bonus #1: “Perfect Timing Indicator Video Masterclass: Capture 1,100% Gains Trading with the Momentum On Your Side”
- Bonus #2:“The Pro Traders Options Guide” – Our walkthrough of every type of option trade we’ll recommend so you are ready to take advantage of every profit opportunity.
- Urgent Bonus: “The Ultimate Stock Unicorn” – My brand-new write-up will break down everything you need to know about my favorite unicorn stock. You’ll get instructions on how to buy... learn how to ensure you pay the best price... get details on the company’s growth plan... and more.
- Access to Our Model Portfolio, With All Current Recommendations
- Access to Our Concierge Team – Any questions you have regarding your subscription can be answered quickly by our full-service staff. Please feel free to call or email them anytime.
- Password-Protected Access to Our Catalyst Cash-Outs Live Website – Here you can see past issues, access the portfolios and read our latest market breakdowns.
Again, just click below to get started.
Or you can call 800-507-1399 or 443-353-4977.
When you really think about it...
There really is NO reason not to at least get the Perfect Timing Indicator today.
You can sign up right now, get the report...
And get it installed on your charts.
Then... it’s yours...
Forever.
You can still go through all the reports and the trainings.
And you can come to every single livestream event for the next year!
If it turns out my type of trading strategy doesn’t work for you, no hard feelings.
You can have a full refund.
I think you’d be crazy to do that with the winning trades I’ve delivered to my readers.
But that’s exactly why I offer such a generous guarantee.
I’m that confident you will see this is the best product ever offered for that price.
Plus, we’ll let you keep the Perfect Timing Indicator and all of the trainings and reports.
Does it get any better than that?
You keep everything no matter what.
And all the risk is on me to deliver...
To get the code to add the Perfect Timing Alert directly to your charts...
Just click the button below to get started now.
Clicking will take you to a secure order form.
There, you can review everything we’ve discussed.
Remember...
We’ve talked about how these green arrows could have preceeded gains as high as 334% on Philip Morris...
Up to 748% on Gold...
And as much as 1,191% on Excelon!
All in three months or less!
Plus... I showed you how the green arrows on Netflix since October 2023 could have indicated as much as 1,611% gains!
It’s incredible!
And keep in mind...
The chart just flashed green on The Ultimate Stock Unicorn
That means NOW is the time to act on this amazing opportunity.
You must hurry.
Momentum is on your side...
And you don’t want to wait and miss out on the biggest gains.
So don’t delay...
Get your Perfect Timing Indicator...
Plus all of the training materials...
And get your hands on the report on our The Ultimate Stock Unicorn.
Click the button below to get started
Clicking doesn’t obligate you to buy in any way.
You’ll be able to review all your bonuses...
Including an extra bonus that you’ll see that I haven’t mentioned yet...
You get it just by clicking below.
So click on the button now...
And I’ll see you next Tuesday for our Catalyst Cash-Outs Live session!

Bryan Bottarelli
June 2025